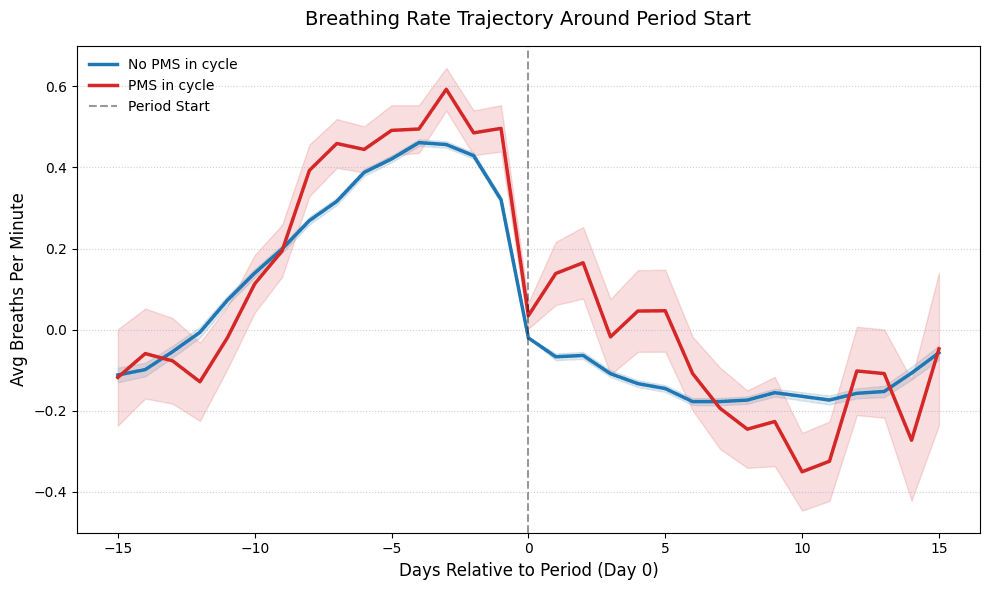
- Breathing rate is the clearest wearable signal of PMS — it rises roughly a week before your period and stays elevated, with a meaningful effect size (Cohen's d > 0.2). Heart rate, HRV, and sleep stages barely move.
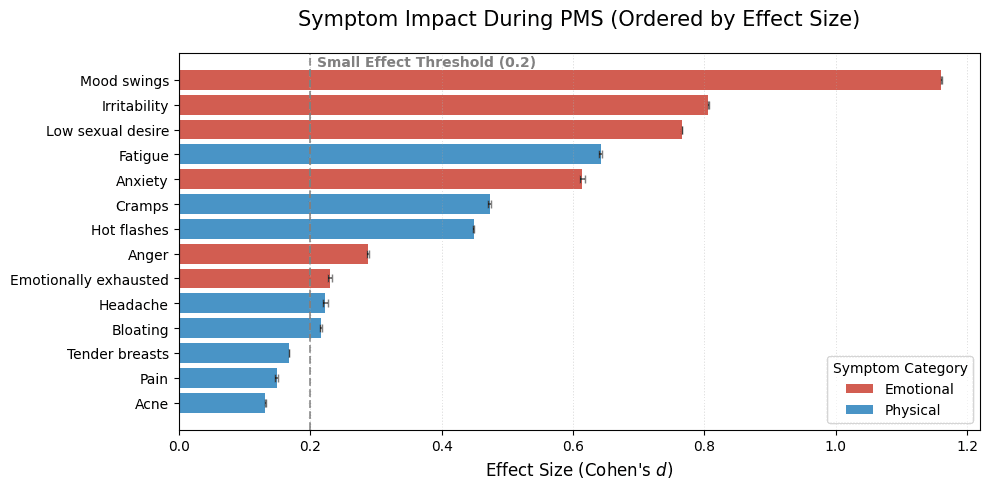
- Emotional symptoms dominate the physical ones — mood swings, irritability, and low sexual desire all show large effect sizes, while the physical markers most people associate with PMS (bloating, headache, acne) rank near the bottom.
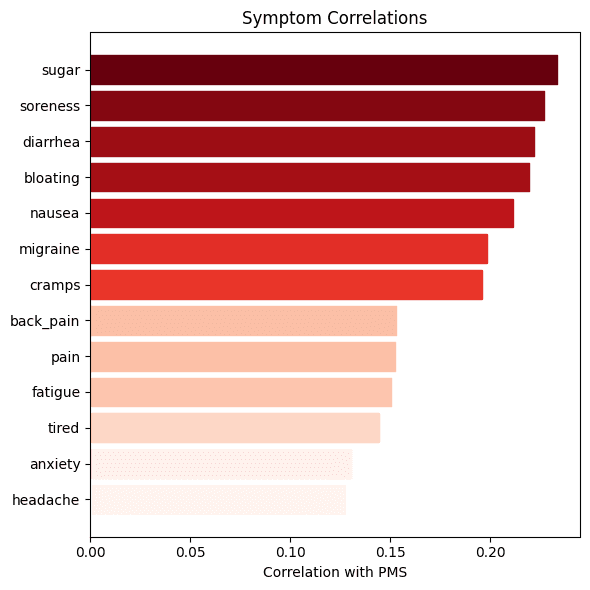
- The strongest symptom correlation with PMS is sugar — followed by soreness, diarrhea, and bloating. The chocolate craving isn't a myth, it's in the data.
Period Tracking
Your Breathing Changes a Week Before Your Period
We often hear that our hormones make us unpredictable, but the data tells us otherwise: its a subtle but shockingly consistent rhythm. To honor the theme of understanding our bodies, we analyzed ~2.5 million sleep and symptom records from 2,941 users. In this study we looked into what PMS actually looks like beneath the surface.
Rocio Mexia DiazAI and Health Researcher
Alistair BrownleeHead of Research
April 7, 2026
Key takeaways
We often hear that our hormones make us unpredictable, but the data tells us otherwise: its a subtle but shockingly consistent rhythm. To honour the theme of understanding our bodies, we analyzed ~2.5 million sleep and symptom records from 2,941 users. In this study we looked into what PMS actually looks like beneath the surface.
Premenstrual Syndrome (PMS)
PMS refers to the physical and emotional symptoms that occur in the luteal phase, typically 1–2 weeks before menstruation. Around 90% of women experience some degree of PMS. Mild symptoms are common and normal, but more severe forms (like PMDD) can be life‑altering.
To get the clearest picture possible, we only analyzed the weeks prior to the start of the menses. We compared luteal phase days with vs without PMS reporting, and used 30-day rolling Z-scores to compare users against their unique physiological baseline.
Get the latest Terra Research reports and insights every week as soon as they're published.
By continuing, I agree to the Privacy Policy and Terms of Service.

Sleep and Activity
Using linear mixed‑effects models, we found small but statistically significant (p<0.05) shifts in our sleep physiology and our activity as a proxy for our behavior.
PMS is often associated with:
- Slightly higher heart rate at night
- Slightly lower HRV
- Small increases in sleep fragmentation and sleep latency
- Small decreases in activity
These shifts show an increase in our sympathetic activation, a state of lower recovery and higher strain on the body. They are not dramatic changes but this lines up with how many of us feel like “I’m jut a bit off…”
The Clear Signal: Breathing Rate
One physiological metric stands out with a meaningful effect size: Nighttime breathing rate increases on PMS days (FDR‑adjusted p < 0.05, Cohen’s d > 0.2). Wearable data shows a higher breathing rate roughly from a week prior to our period until a week later on cycles where PMS is reported.
Subjective or Objective
No one understands our body like we do, sometimes the best intuition is listening to how we feel and not a recovery or and HRV score.
PMS days are associated with substantially higher reporting of emotional and physical symptoms. These are all large effects (|d| > 0.2). So while physiology is subtle, the emotional and physical symptom signal is very real.
We also ran a direct comparison between PMS days and period days for cramps, and it turns out cramp reporting is higher on PMS days than period days. Why?
This might reflect our behavior when it comes to tagging, we accept periods come with cramps and don’t tag them. Or, some women might experience more cramps during PMS than periods. As with anything subjective, there are many ways to interpret this!
The Chocolate Craving
We had a little fun exploring our data, and besides linear models and statistical test we checked for simple correlations, right in front of our eyes. To no one’s surprise the highest correlation between user tags were PMS with sugar!
Conclusion
The data offers a powerful reminder: your intuition is often more sensitive than your wearable. Our analysis shows that while PMS feels "loud" emotionally and physically, it remains quiet on your wrist. Aside from a clear shift in nighttime breathing rate, most physiological markers, like heart rate and sleep stages, show only subtle, minor fluctuations. If your app says your recovery is "optimal" but you feel exhausted trust yourself.
Understanding these subtle rhythms gives you the leverage to work with your biology rather than against it. Whether you’re an athlete or just having a busy week, if your energy dips in the luteal phase, remember it’s a biological pattern. Listen to the signs and adjust for them!
Summary
- Can my wearable actually detect PMS before my period starts?
- Partially. Across ~2.5 million sleep and symptom records from 2,941 users, nighttime breathing rate was the one physiological metric with a meaningful effect size (Cohen's d > 0.2, FDR-adjusted p < 0.05), rising roughly a week before menstruation and staying elevated until a week after. Other markers like heart rate, HRV, and sleep fragmentation shifted in the expected direction but the effects were small.
- Why do I feel awful during PMS when my recovery score says I'm fine?
- Because PMS is loud subjectively but quiet physiologically. Emotional and physical symptom tags showed large effects (|d| > 0.2) on PMS days, while objective metrics like nighttime heart rate, HRV, and sleep latency only shifted by small, statistically significant amounts. If your app says recovery is optimal but you feel exhausted, trust yourself — your intuition is more sensitive than the sensor.
- How early before my period do physiological changes actually start?
- About a week. Nighttime breathing rate begins climbing roughly 7 days before period start in cycles where PMS is reported, and remains elevated until about a week after menstruation begins. This makes breathing rate one of the earliest and most reliable wearable signals of the luteal phase shift.
- What's happening to my body during PMS according to wearable data?
- The pattern points to increased sympathetic activation: slightly higher nighttime heart rate, slightly lower HRV, small increases in sleep fragmentation and sleep latency, and a small decrease in daytime activity. None of these are dramatic, but together they describe a state of lower recovery and higher strain — which lines up with the common feeling of being 'just a bit off.'
- Why do I report more cramps during PMS than during my actual period?
- In this dataset, cramp tagging was actually higher on PMS days than on period days. This likely reflects tagging behavior — many women accept cramps as a given during menstruation and stop logging them — though some may genuinely experience more cramping premenstrually. Either way, the assumption that cramps peak during the period itself isn't supported by the user-reported data.
- Are sugar cravings during PMS actually a real thing?
- Yes, and it's the strongest tag correlation in the dataset. Among all symptom and behavior tags users logged, PMS correlated most highly with sugar cravings. So the chocolate craving stereotype shows up clearly in real wearable and self-report data.
- Should I trust how I feel or what my wearable tells me during the luteal phase?
- Trust how you feel. The analysis found that emotional symptoms produced larger effect sizes than physical ones, and both dwarfed the subtle physiological shifts visible on wearables. Around 90% of women experience some PMS, so if your energy dips in the luteal phase, treat it as a real biological pattern and adjust — even if your recovery score disagrees.
- How was PMS isolated from normal cycle variation in this study?
- The researchers compared luteal phase days with PMS reporting against luteal days without it, restricting the analysis to weeks before menstruation onset for a cleaner signal. They applied 30-day rolling Z-scores so each user was compared against her own physiological baseline, then used linear mixed-effects models to detect within-person shifts rather than population averages.
Continue reading
Running
Data Shows Most Runners Don't Actually Get Faster
How do runners actually get faster? We analyzed 856,000 running activities to find out who actually gets faster. It wasn't the intense ones, but rather the consistent ones. Showing up month after month beat everything flashier. Boring, as it turns out, is fast.
May 7, 2026

Marathon Series
The Data Behind the London Marathon
While Sabastian Sawe was busy breaking the two-hour marathon barrier in London, the watches of 571 amateur runners told a quieter but equally fascinating story. GPS devices over-measured the course by 527 metres on average, faster runners ran with higher heart rates than the slower ones did, and Coros watches reported 47% more calories per kilometre than physiology actually supports.
April 27, 2026

London Data
Tube Strikes Made Londoners Active
During the April 2026 Tube strikes, Londoners adapted by cycling more—activity tripled, e-bike commutes rose 13%, and 19% of cyclists were entirely new to riding. Data analysis of 1,566 weekday rides revealed e-bike share jumped from 54.9% to 67.5%, with commutes often staying local. The strikes disrupted transit but highlighted Londoners' resilience in finding alternative ways to move.
April 24, 2026

Endurance Training
Running Is The Hardest Endurance Sport? Not so Fast
Which sport is hardest on the heart? We ran the question through hundreds of thousands of sessions across nine activity types. Running dominates minute-for-minute. It has the highest average, highest peak, highest sustained intensity. But its shorter sessions mean total cardiovascular load per outing often falls behind skiing or hiking. The shape of the heart rate curve tells a different story for every sport, and the weighting method you pick changes the answer.
April 23, 2026