Alcohol adds ~7 mins awake time in bed — the real story is the unpredictability that comes with alcohol: without alcohol, most people fall asleep within 15 minutes, but with it, that consistency disappears entirely.
More wake-ups and more fragmented nights — yet surprisingly, no significant effect on time spent in light, deep, or REM stages, suggesting the disruption in in transitions, not structured.
Respiratory rate rises by 0.17 beats per min — a small but consistent signal that your body is working harder to get oxygen while you sleep than normal.
Alcohol Effects
Alcohol Doesn't Ruin Your Sleep The Way You Think
We analyzed 15,000 nights of sleep data to uncover what drinking before bed actually does to your rest. Using a mixed effects model, we found that alcohol increases time awake in bed, disrupts sleep with more wakeup events, and elevates your breathing rate. These are all signs your body is working harder, not resting.
Faraaz AkhtarAI and Health Researcher
Alistair BrownleeHead of Research
March 30, 2026
Key takeaways
Get the latest Terra Research reports and insights every week as soon as they're published.
By continuing, I agree to the Privacy Policy and Terms of Service.

A piece of data that we sometimes have access to includes knowing when a user had alcohol before going to bed. Last Wednesday, I sat down and cleaned this data to see what I could find. The result? 15,000 nights of sleep. Somehow, we’ve found ourselves in a unique position that allows us to investigate the effects of drinking before sleep quite rigorously.
We ran this data through a mixed effects model, and analyzed the statistically significant effects. Broadly, drinking before you sleep wrecks your sleep. You often spend more time awake in bed, your recovery is worse, you wake up more often, and your breathing becomes weird. But you probably guessed this. So let’s have a look at the numbers.
For time spent awake in bed, we saw an effect of 398 seconds, with a standard error 116 seconds for extra time spent awake in bed. When I first saw this, I was satisfied. It was an effect that made sense. To have a deeper look, I plotted the distribution of these awake times. Turns out, I was losing quite a bit of nuance.
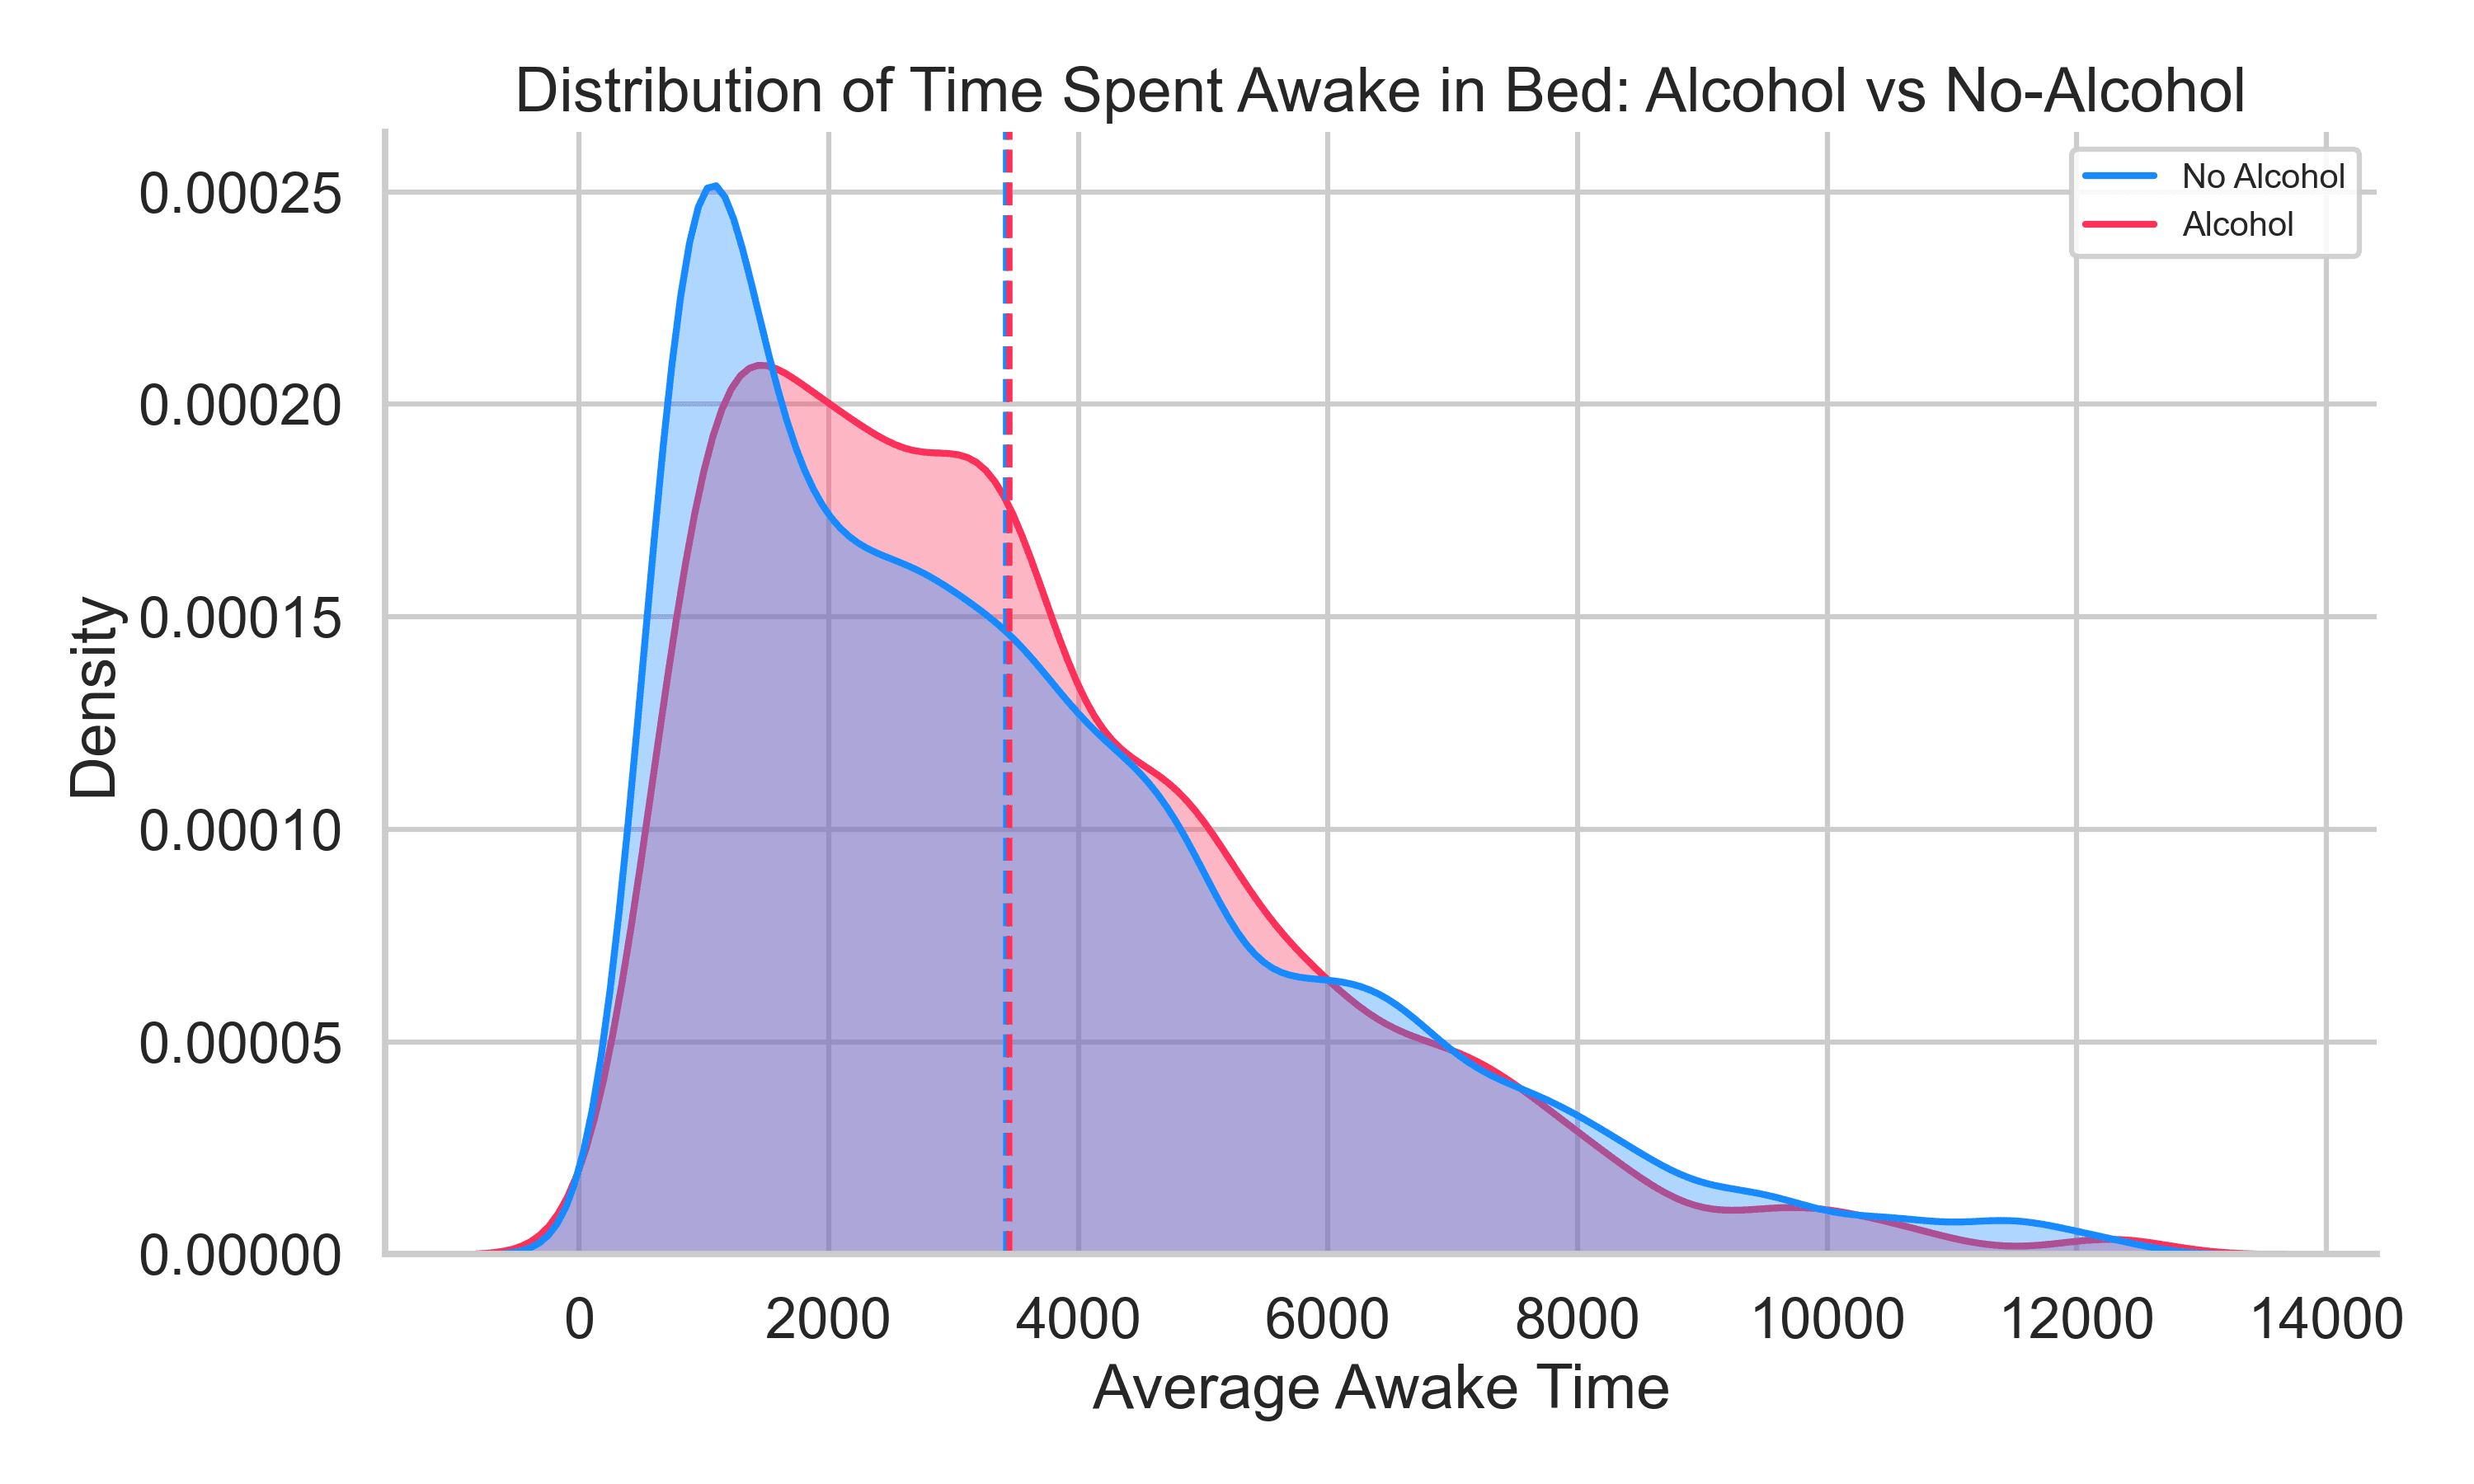
Through our mixed effects model, we know that alcohol does overall make you spend more time awake in bed. However, the distribution does tell us something more. The spike at ~1000 seconds tells us that alcohol widens the spread of time taken to fall asleep. So while most people would fall asleep within the first 15 minutes without alcohol, this guarantee vanishes when alcohol is consumed before going to bed.
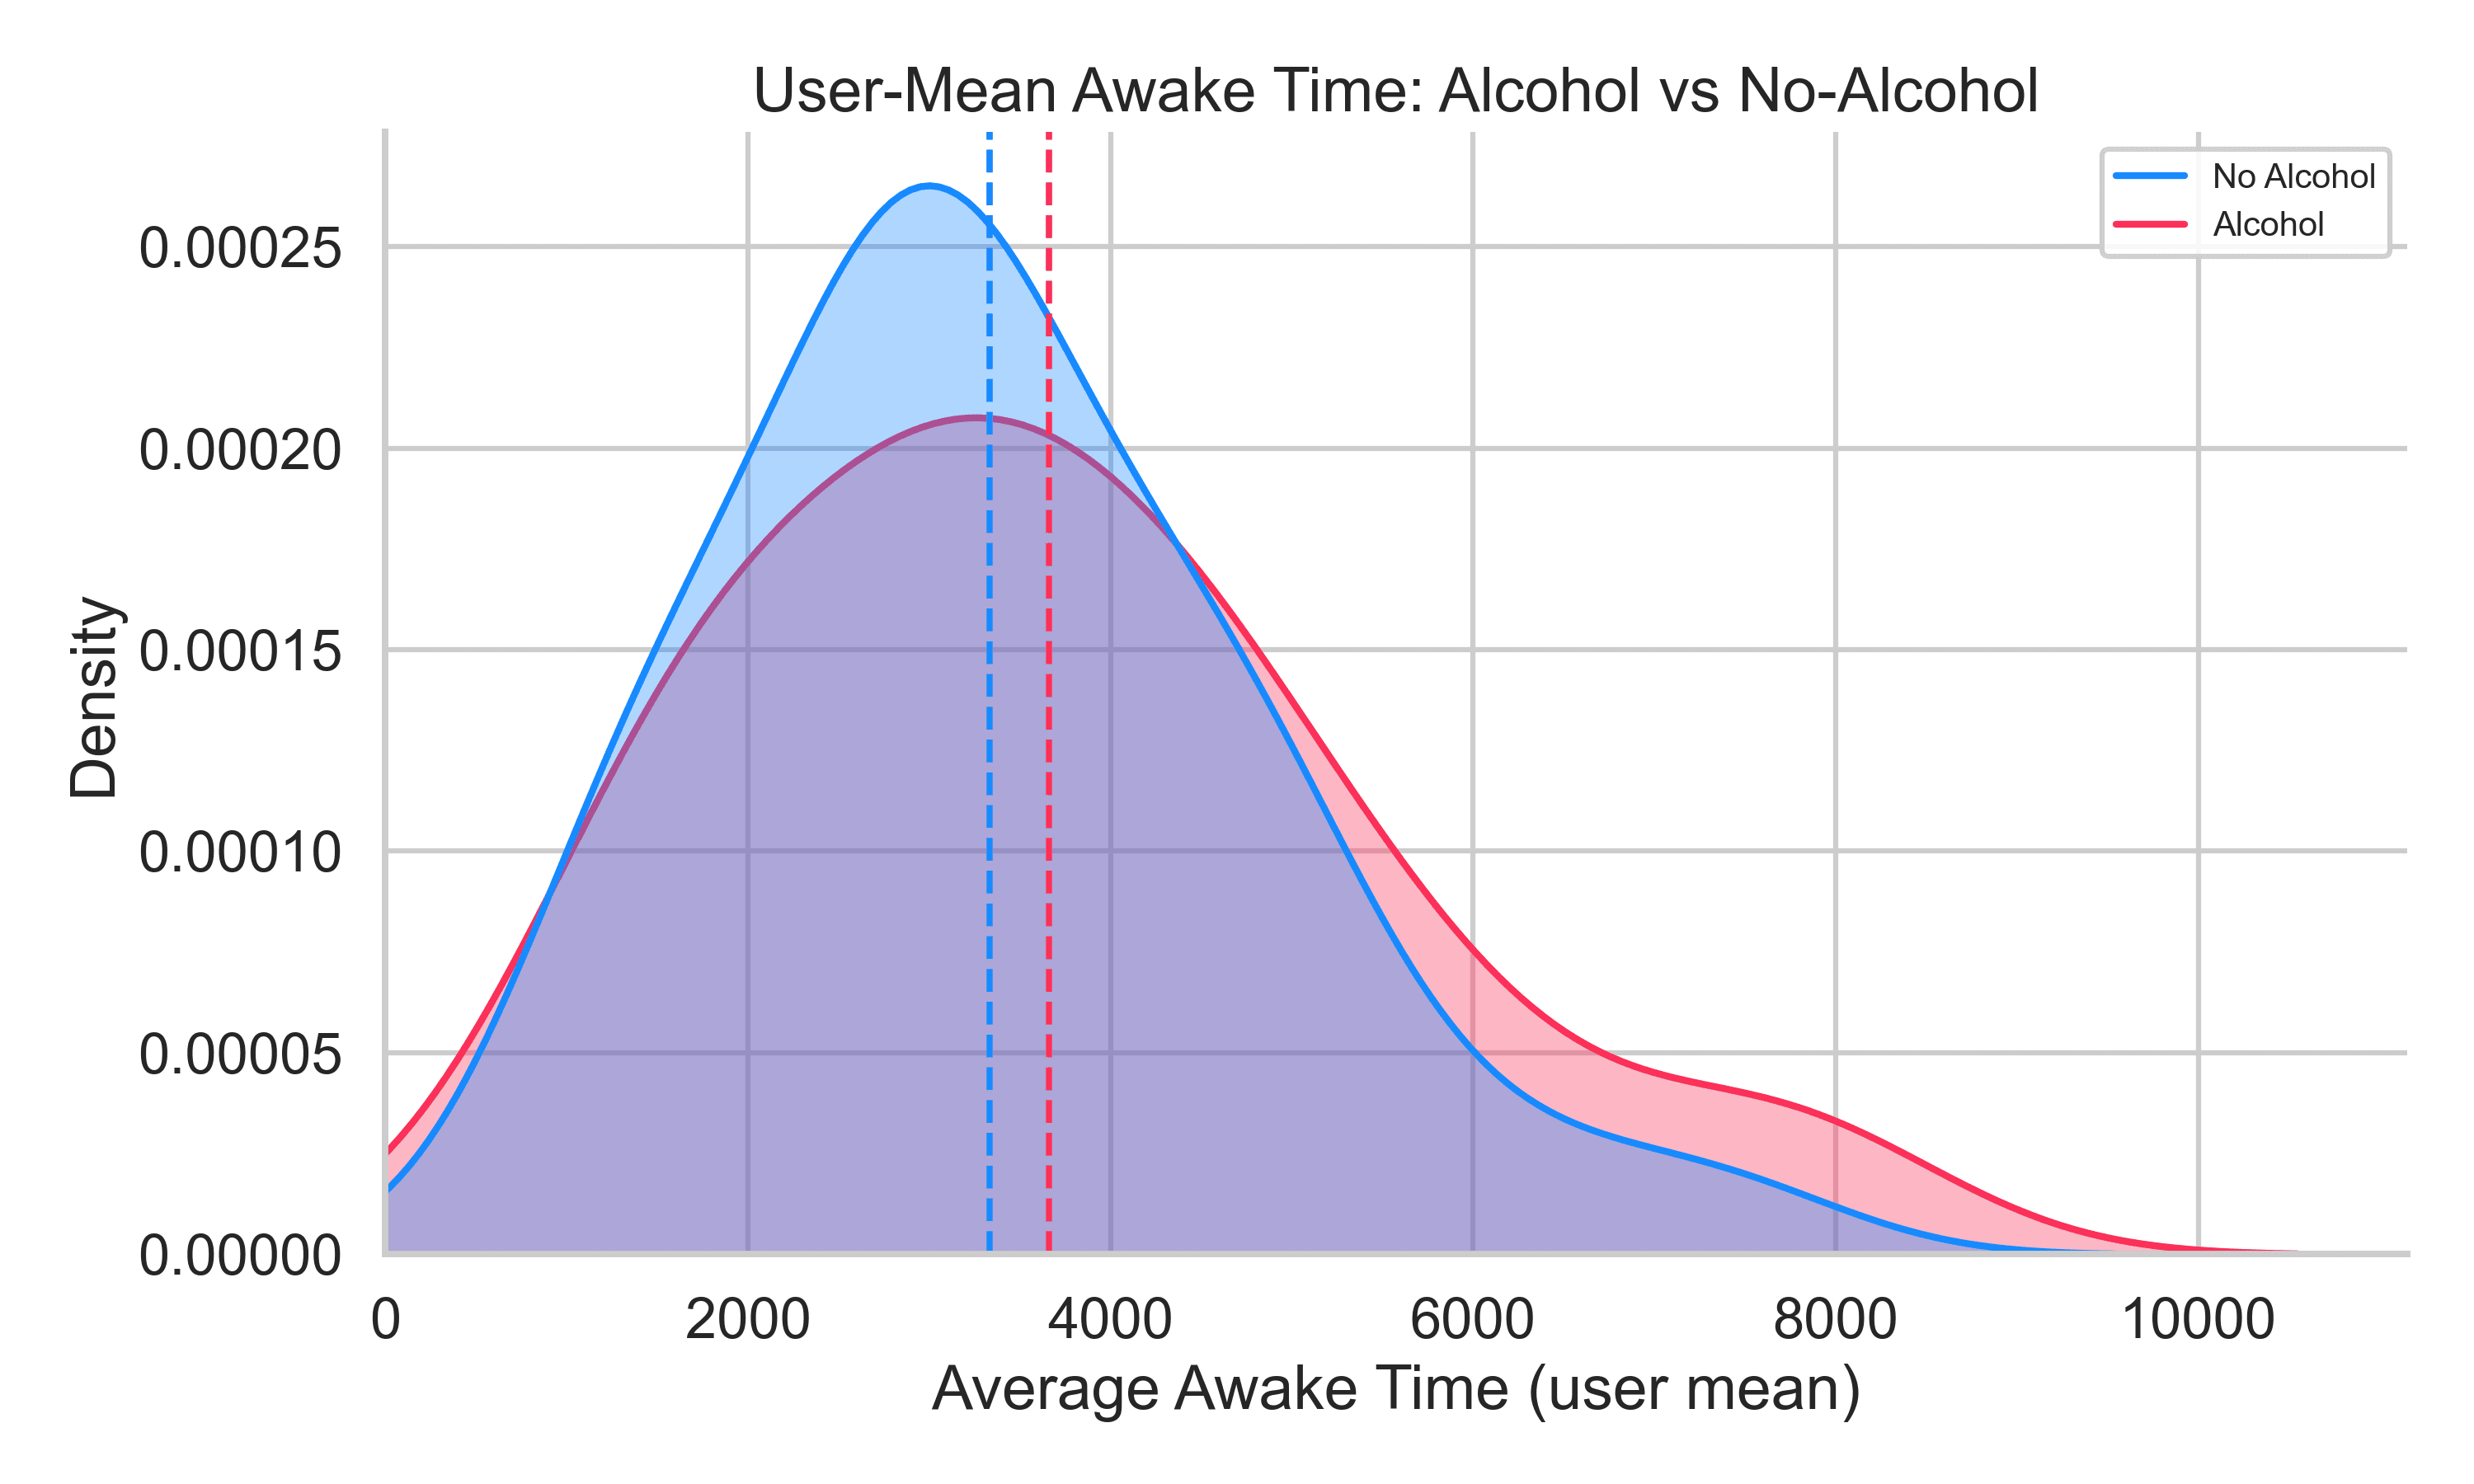
The only guarantee that remains is that you will almost definitely spend more time awake. Figure 2 shows this more cleanly, comparing means between users that logged both non-alcohol and alcohol nights.
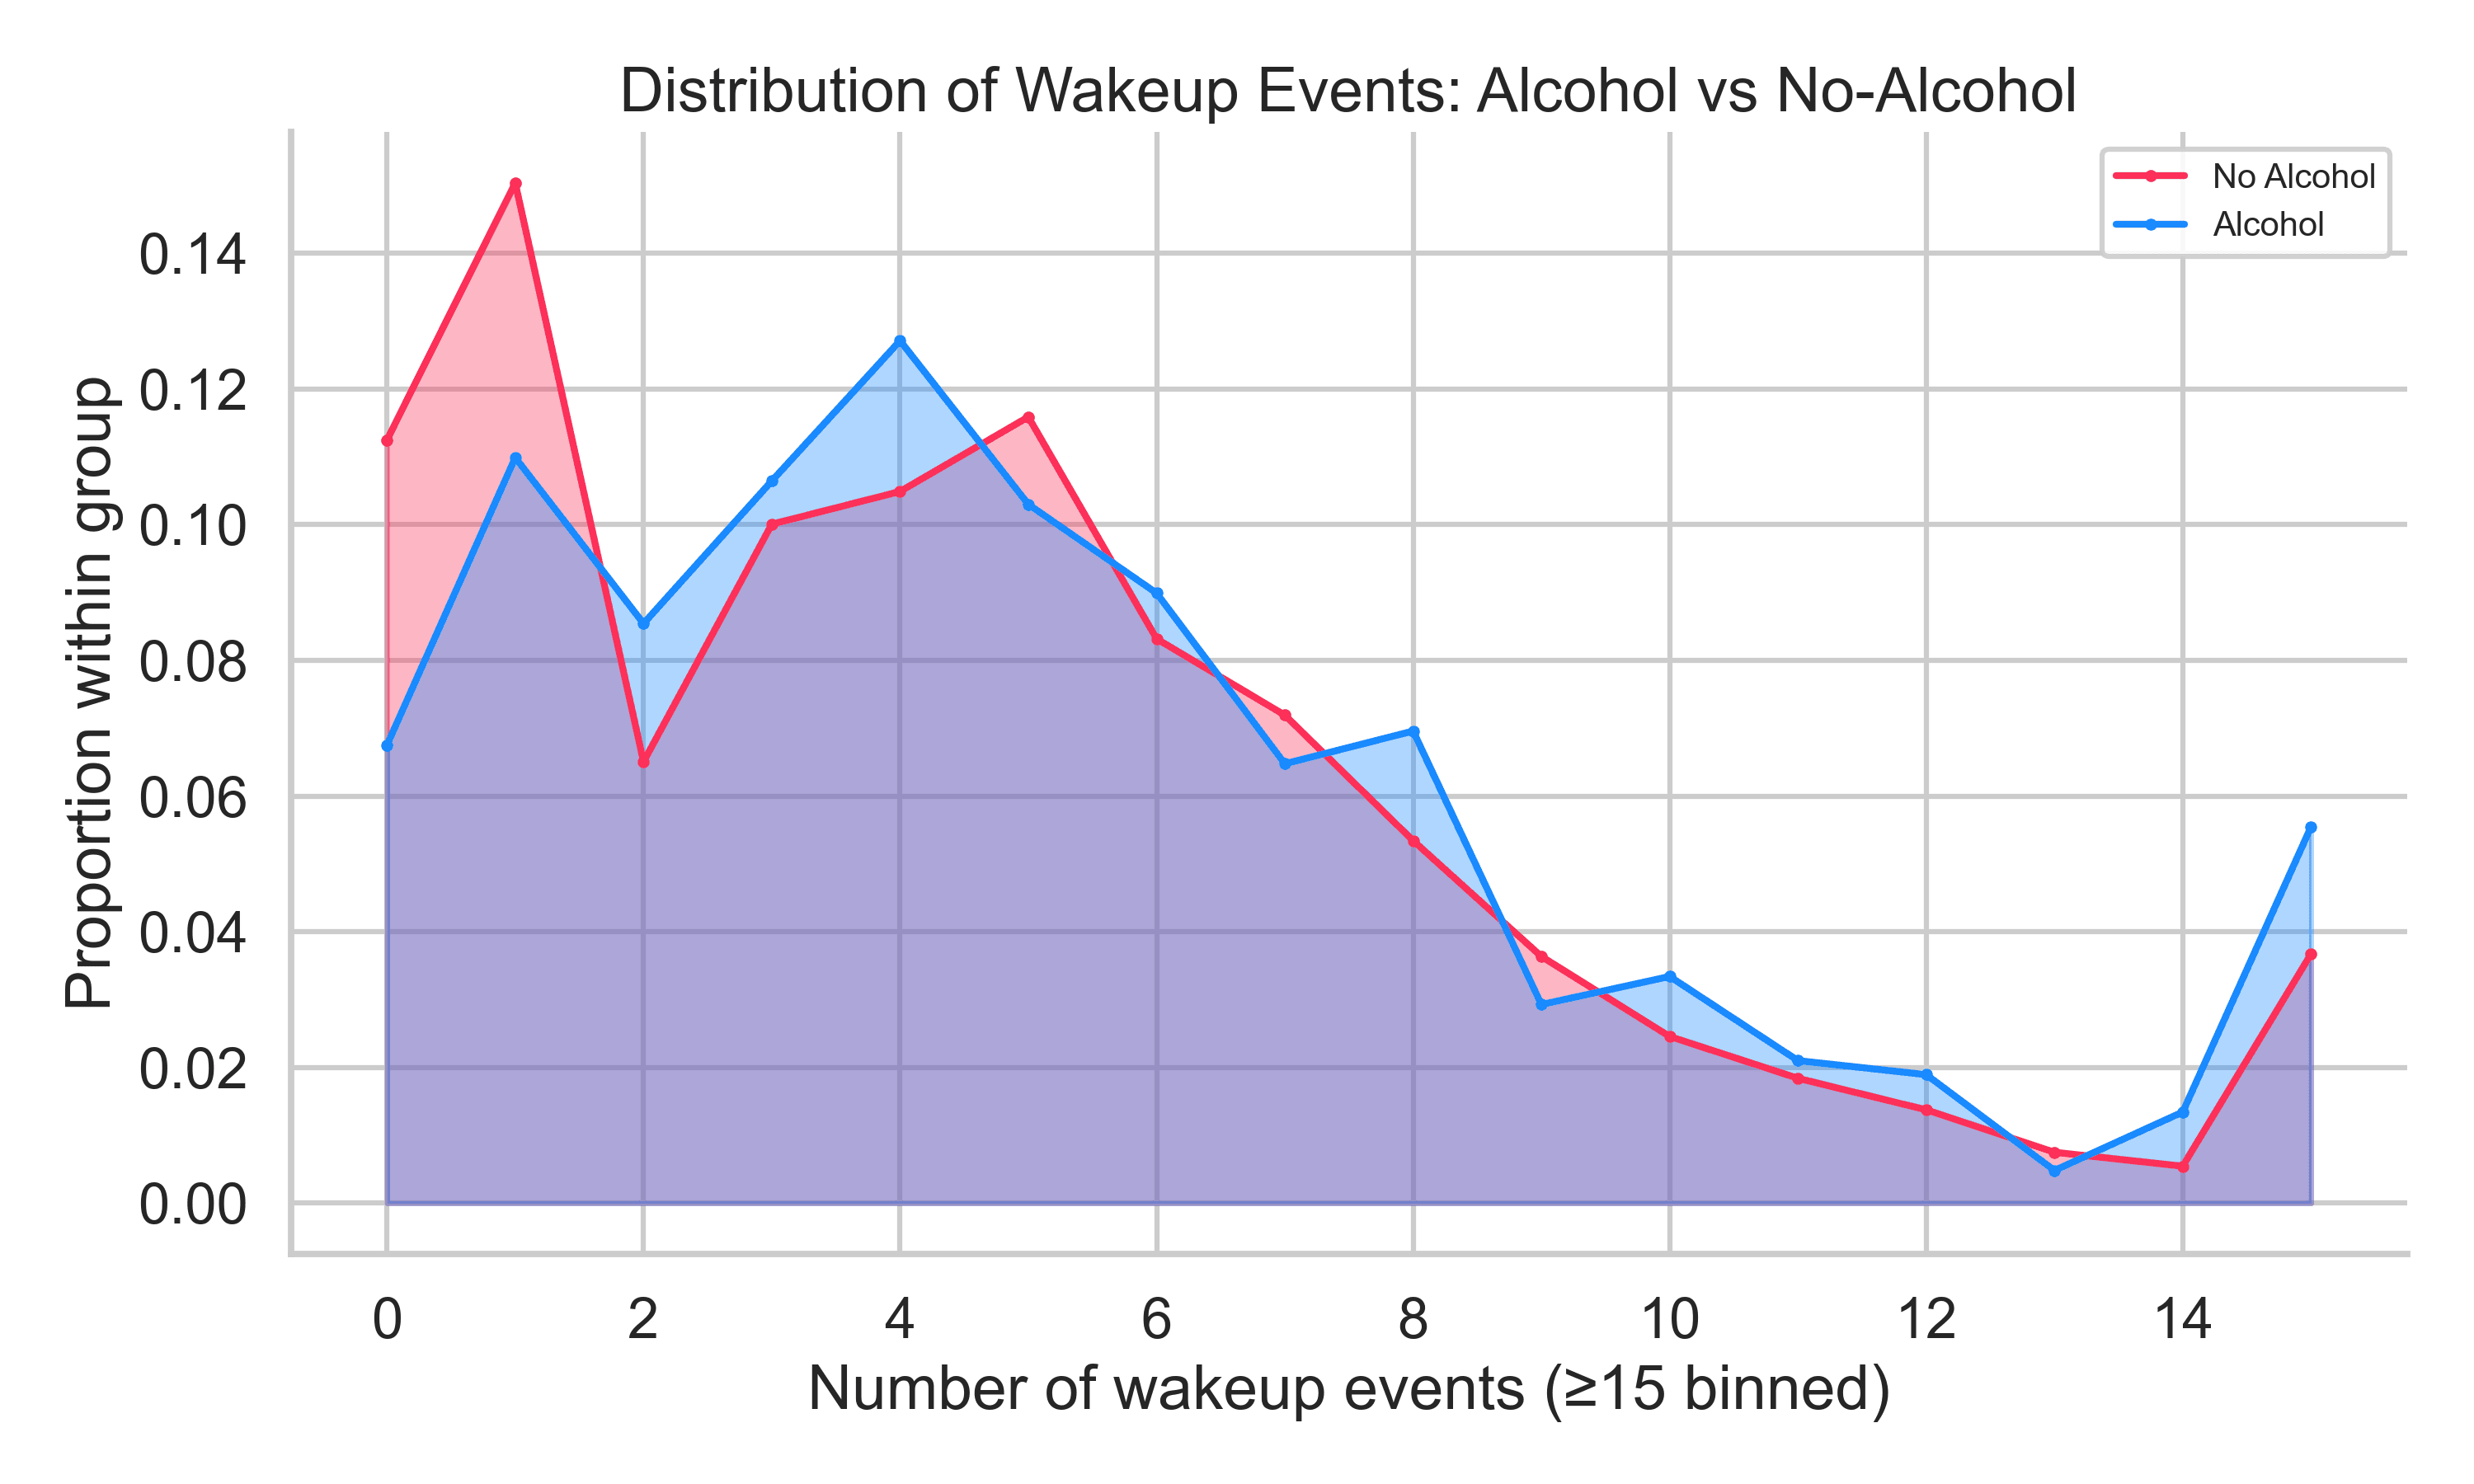
Let’s move and have a look at the quality of sleep. Through our model we saw an increased number of wakeup events on nights where alcohol was drank. When looking at proportions of number of wakeup events within the alcohol and no-alcohol groups, this effect of alcohol disrupting sleep remained consistent.
Surprisingly, we saw no significant effects in the stages of sleep: light, deep, and REM. This was an effect I had expected to see, particularly due to the changes in breathing we saw in our analysis. There’s two main values we look at when assessing breathing during sleep; blood oxygenation and respiratory rate. We excluded a reduced blood oxygenation effect from this report due to a p-value of 0.06.
However, respiratory rate shows a much clearer link, with a p-value of 0.02. Specifically, we saw an increase of 0.17, with a standard error 0.07. This shows up quite clearly in within-user differences, as shown below.
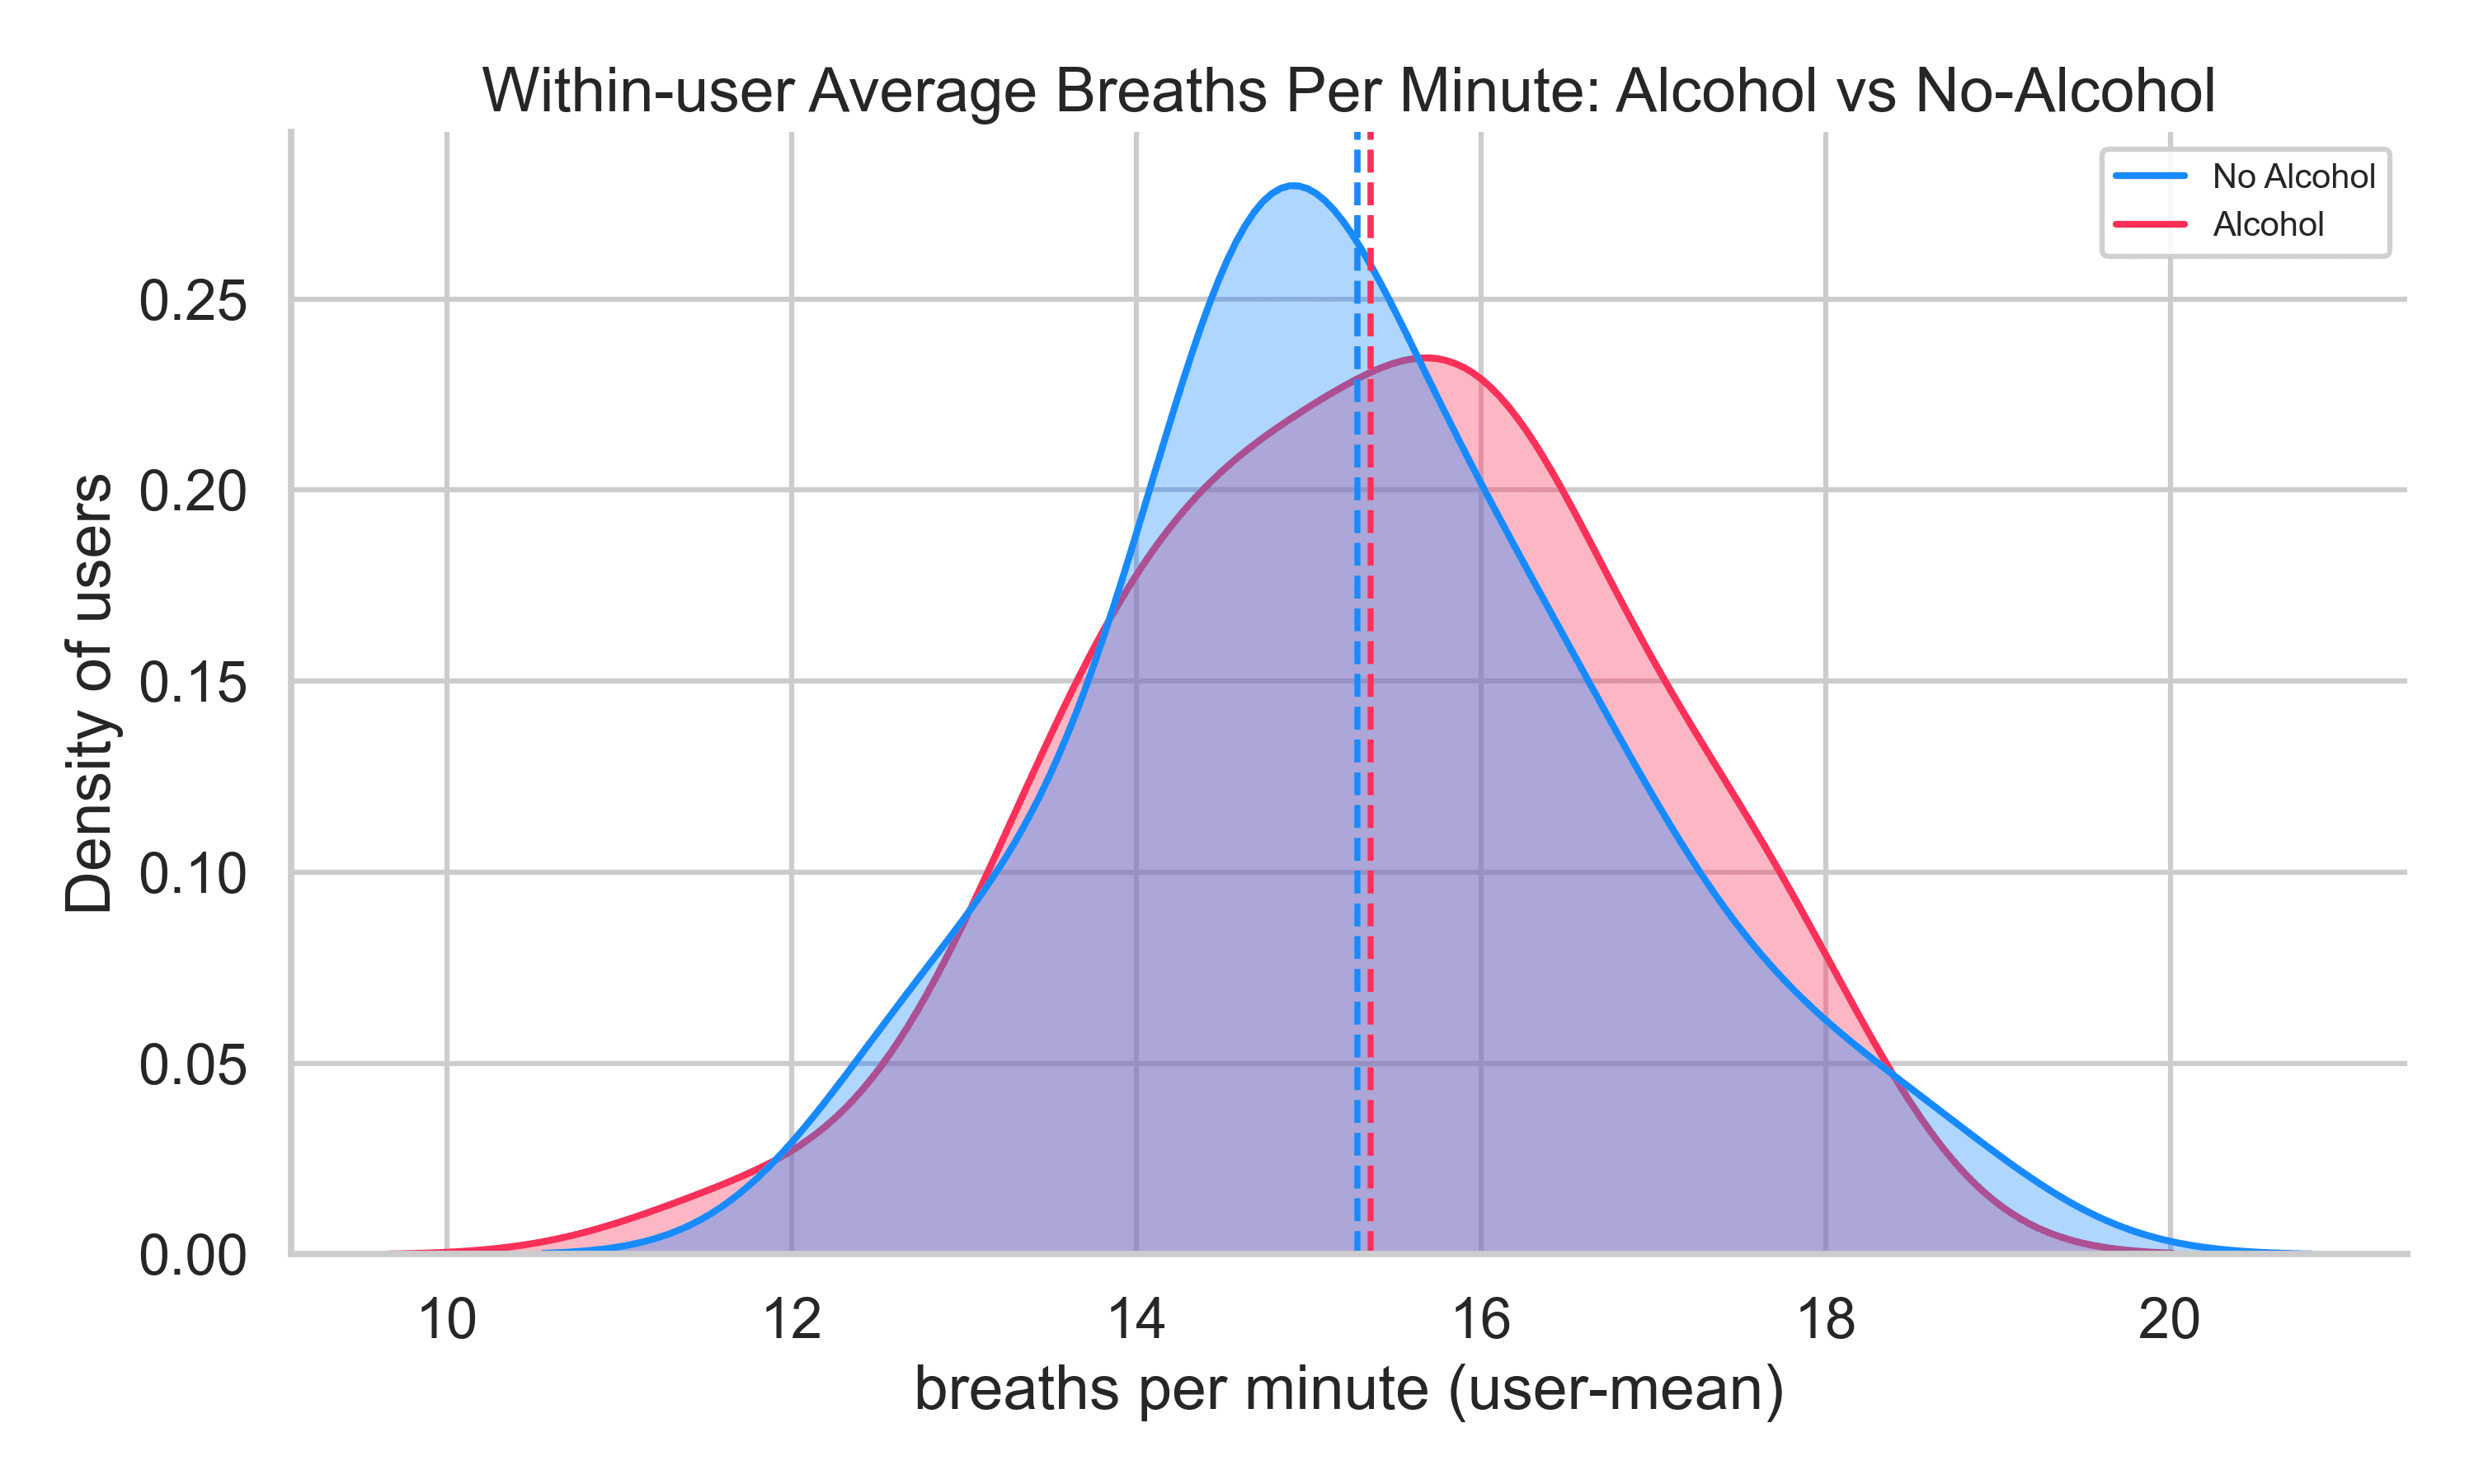
While increased respiratory rates are not strictly a bad thing, it indicates that your body is trying harder to get oxygen and get rid of carbon-dioxide. If alcohol pushes this increase past 20 breaths per minute, it becomes a big cause of concern!
Putting these findings together, we come to the conclusion that if you consume alcohol at night, it make you sleep badly in almost every way. You have a hard time falling asleep. you wake up more and your body has to try harder to meet its oxygen demand.
Bonus results: We found that you nap less on days where you decide to drink alcohol before going to bed! Very strange and perhaps a case of statistics hiding more than they reveal. We also saw increased step counts on days where users recorded alcohol before bed—maybe a walk to pub!
Summary
- Do most runners actually get faster from training?
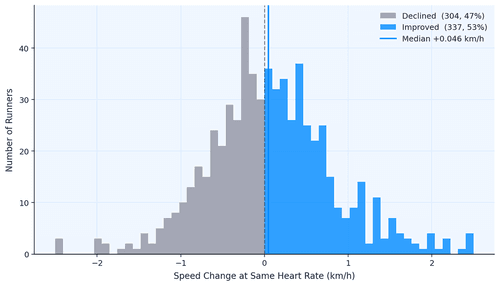
- Not by default. Across 641 runners tracked for a median of 3.5 years, the population-level improvement in speed-at-heart-rate was effectively zero. Roughly 53% of runners got faster and 47% got slower. Improvement happens — but it's not the automatic outcome of putting in the miles.
- Does consistency or intensity matter more for running improvement?
- Consistency. Month-to-month variability in training frequency was the most robust predictor of improvement in this dataset, outperforming both total volume and high-intensity session fraction. Runners with stable, repeatable training patterns improved most, even at modest mileage.
- Does high-intensity training make you faster?
- On its own, no. Runners in the Intensity-Focused phenotype — doing nearly half their sessions at high heart-rate reserve but running fewer total kilometers — actually got slower on average, with a median decline of about 0.09 km/h at the same heart rate. Intensity without enough volume underneath trended negative.
- How much should I run per month to improve aerobic fitness?
- The dose-response was roughly linear. Runners in the bottom training-volume quintile (~2.3 runs/month) had a 48% chance of improving, while runners in the top quintile (~14.5 runs/month) had a 59% chance — a 17-percentage-point gap. More volume measurably shifts the odds, but consistency at any volume matters just as much.
- Can wearable data measure running fitness improvements?
- Yes. Speed-HR curves built from consumer wearable data can detect aerobic fitness shifts at population scale, without lab testing. Comparing a runner's speed at matched heart-rate windows between early and late training periods captures changes in aerobic efficiency directly — no VO₂max test, lactate threshold, or controlled treadmill protocol required.
- Why am I not getting faster despite training hard?
- The data suggests intensity in isolation rarely produces the gains runners expect. Without enough total volume and month-to-month consistency, hard sessions can move the speed-HR curve in the wrong direction. The runners who improved most weren't training harder — they were training more reliably.
- What is the single best predictor of long-term running improvement?
- Consistency. Across every analytical split tested — halves, thirds, quarters, fifths, and tenths of each runner's history — month-to-month variability in training was the most durable predictor of speed-at-heart-rate gains. Showing up reliably mattered more than any single workout, weekly mileage target, or intensity prescription.
- What does "speed-at-heart-rate" actually mean?
- It's how fast a runner can sustain a given cardiac effort. If you can run faster at the same heart rate as before, your aerobic engine has improved. Speed-HR curves are one of the oldest tools in exercise physiology, and applying them to wearable data lets researchers track aerobic adaptation outside the lab.
Continue reading
Running
Data Shows Most Runners Don't Actually Get Faster
How do runners actually get faster? We analyzed 856,000 running activities to find out who actually gets faster. It wasn't the intense ones, but rather the consistent ones. Showing up month after month beat everything flashier. Boring, as it turns out, is fast.
May 7, 2026

Marathon Series
The Data Behind the London Marathon
While Sabastian Sawe was busy breaking the two-hour marathon barrier in London, the watches of 571 amateur runners told a quieter but equally fascinating story. GPS devices over-measured the course by 527 metres on average, faster runners ran with higher heart rates than the slower ones did, and Coros watches reported 47% more calories per kilometre than physiology actually supports.
April 27, 2026

London Data
Tube Strikes Made Londoners Active
During the April 2026 Tube strikes, Londoners adapted by cycling more—activity tripled, e-bike commutes rose 13%, and 19% of cyclists were entirely new to riding. Data analysis of 1,566 weekday rides revealed e-bike share jumped from 54.9% to 67.5%, with commutes often staying local. The strikes disrupted transit but highlighted Londoners' resilience in finding alternative ways to move.
April 24, 2026

Endurance Training
Running Is The Hardest Endurance Sport? Not so Fast
Which sport is hardest on the heart? We ran the question through hundreds of thousands of sessions across nine activity types. Running dominates minute-for-minute. It has the highest average, highest peak, highest sustained intensity. But its shorter sessions mean total cardiovascular load per outing often falls behind skiing or hiking. The shape of the heart rate curve tells a different story for every sport, and the weighting method you pick changes the answer.
April 23, 2026