- Mondays are biologically strong – despite being unpopular, Mondays consistently showed the highest average HRV across more than 1,000 users, suggesting that weekend rest doesn’t immediately register but instead boosts recovery early in the week.
- Consistency beats quantity – people who slept longer and more consistently had significantly higher HRV, while those with short, variable sleep patterns had the lowest. Stability in sleep seems to matter as much as overall duration.
- Weekends bring variability, not always recovery – while people slept the most on weekends, HRV often hit its lowest values on Saturday and Sunday, reflecting the accumulated strain of the week and the mixed effects of late nights, socialising, or lie-ins.
Sleep Tracking Series
Why Mondays Might Be Your Healthiest Day: What 1,000+ Sleepers Taught Us About Recovery
At Terra, we recently ran an analysis on wearable data from over a thousand users, focusing on two key metrics: sleep duration and heart rate variability (HRV). We sought to gain insight into trends in recovery, stress, and overall well-being. What we found surprised us.
Alistair BrownleeHead of Research
Cameron CrawfordAI Engineer
September 18, 2025
Key takeaways
Why Mondays Might Be Your Healthiest Day: What 1,000+ Sleepers Taught Us About Recovery
There’s something strange that happens on Mondays. If you are anything like me, you probably don’t hate them but they are definitely not your most loved day of the week. But biologically? The data tells a different story.
At Terra, we recently ran an analysis on wearable data from over a thousand users, focusing on two key metrics: sleep duration and heart rate variability (HRV). We sought to gain insight into trends in recovery, stress, and overall well-being. What we found surprised us.
How We Sleep and Recover
Across the entire dataset, the average sleep duration was 7.06 hours, with a standard deviation of 1.19 hours. The mean overnight HRV was 44.19 milliseconds, with a large standard deviation of 26.81 ms.
That spread tells us something important: people vary wildly, both in how long they sleep and how their autonomic nervous system behaves. We must note that this data is based on a 28-day sample of over 1,000 users, which provides insights into a population of wearable users rather than individuals.
Get the latest Terra Research reports and insights every week as soon as they're published.
By continuing, I agree to the Privacy Policy and Terms of Service.

Weekly Rhythms: The Hidden Patterns of Recovery
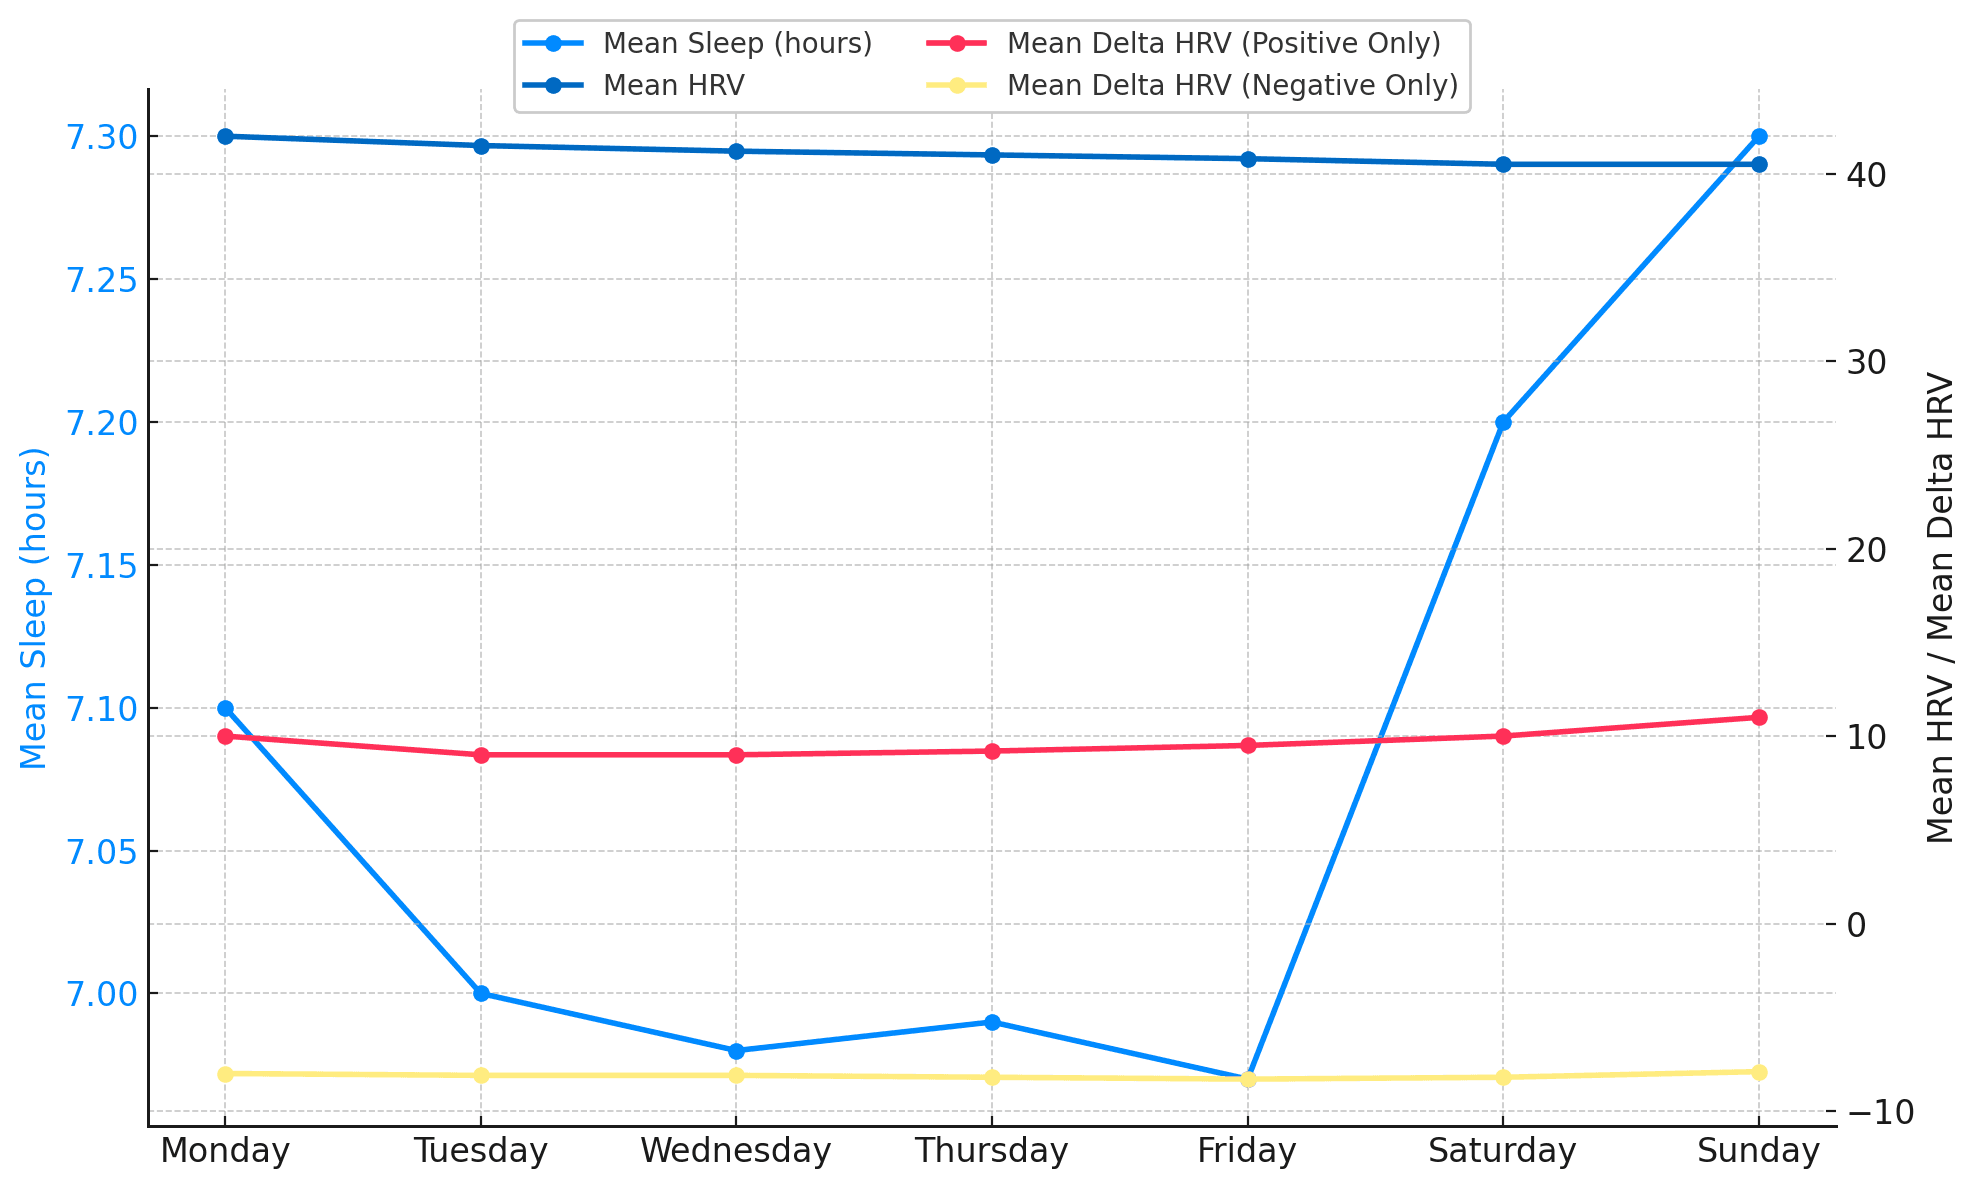
I was interested to see how the population trends would present when we looked at the data by day of the week. We include HRV delta here to demonstrate the change in the state of the nervous system between today and yesterday. More on this later, but if the world were simple; a good nights sleep would be accompanied by an improvement in HRV from yesterday.
| Day | Avg Sleep (h) | Avg HRV (ms) | Avg HRV Δ (ms) |
|---|---|---|---|
| Monday | 7.08 | 45.55 | 3.18 |
| Tuesday | 6.99 | 46.14 | 0.59 |
| Wednesday | 6.96 | 44.86 | -1.28 |
| Thursday | 6.97 | 44.11 | -0.75 |
| Friday | 6.94 | 43.67 | -0.44 |
| Saturday | 7.18 | 42.48 | -1.19 |
| Sunday | 7.28 | 42.37 | -0.11 |
The pattern here is fascinating: on average that population sleep the most on Saturdays and Sundays (Friday and Saturday nights), but HRV peaks on Mondays and Tuesdays.
Why? Likely because HRV isn’t just about sleep. It is multifactorial (more on this later!) and reflects cumulative strain. If we’re running a sleep deficit all week, a Saturday lie-in doesn’t fully restore the baseline. The data suggests that the benefits of the weekends rest kicks in a day or two later — explaining why HRV is highest on Monday or Tuesday.
It’s also worth noting that HRV drops as the week wore on, hitting its lowest values by the weekend. That implies we’re not just tired before the weekend; we’re likely bringing a full week of accumulated load into it. This is nicely visualised in the graph below where we have distinguished between a positive and negative HRV delta.
You can see from Figure 1 that the mean HRV delta trends diverged over the weekend, both the mean of the positive and negative deltas increased, most probably demonstrating an increase in the variability of our weekend activities!
How Common Are Highs and Lows?
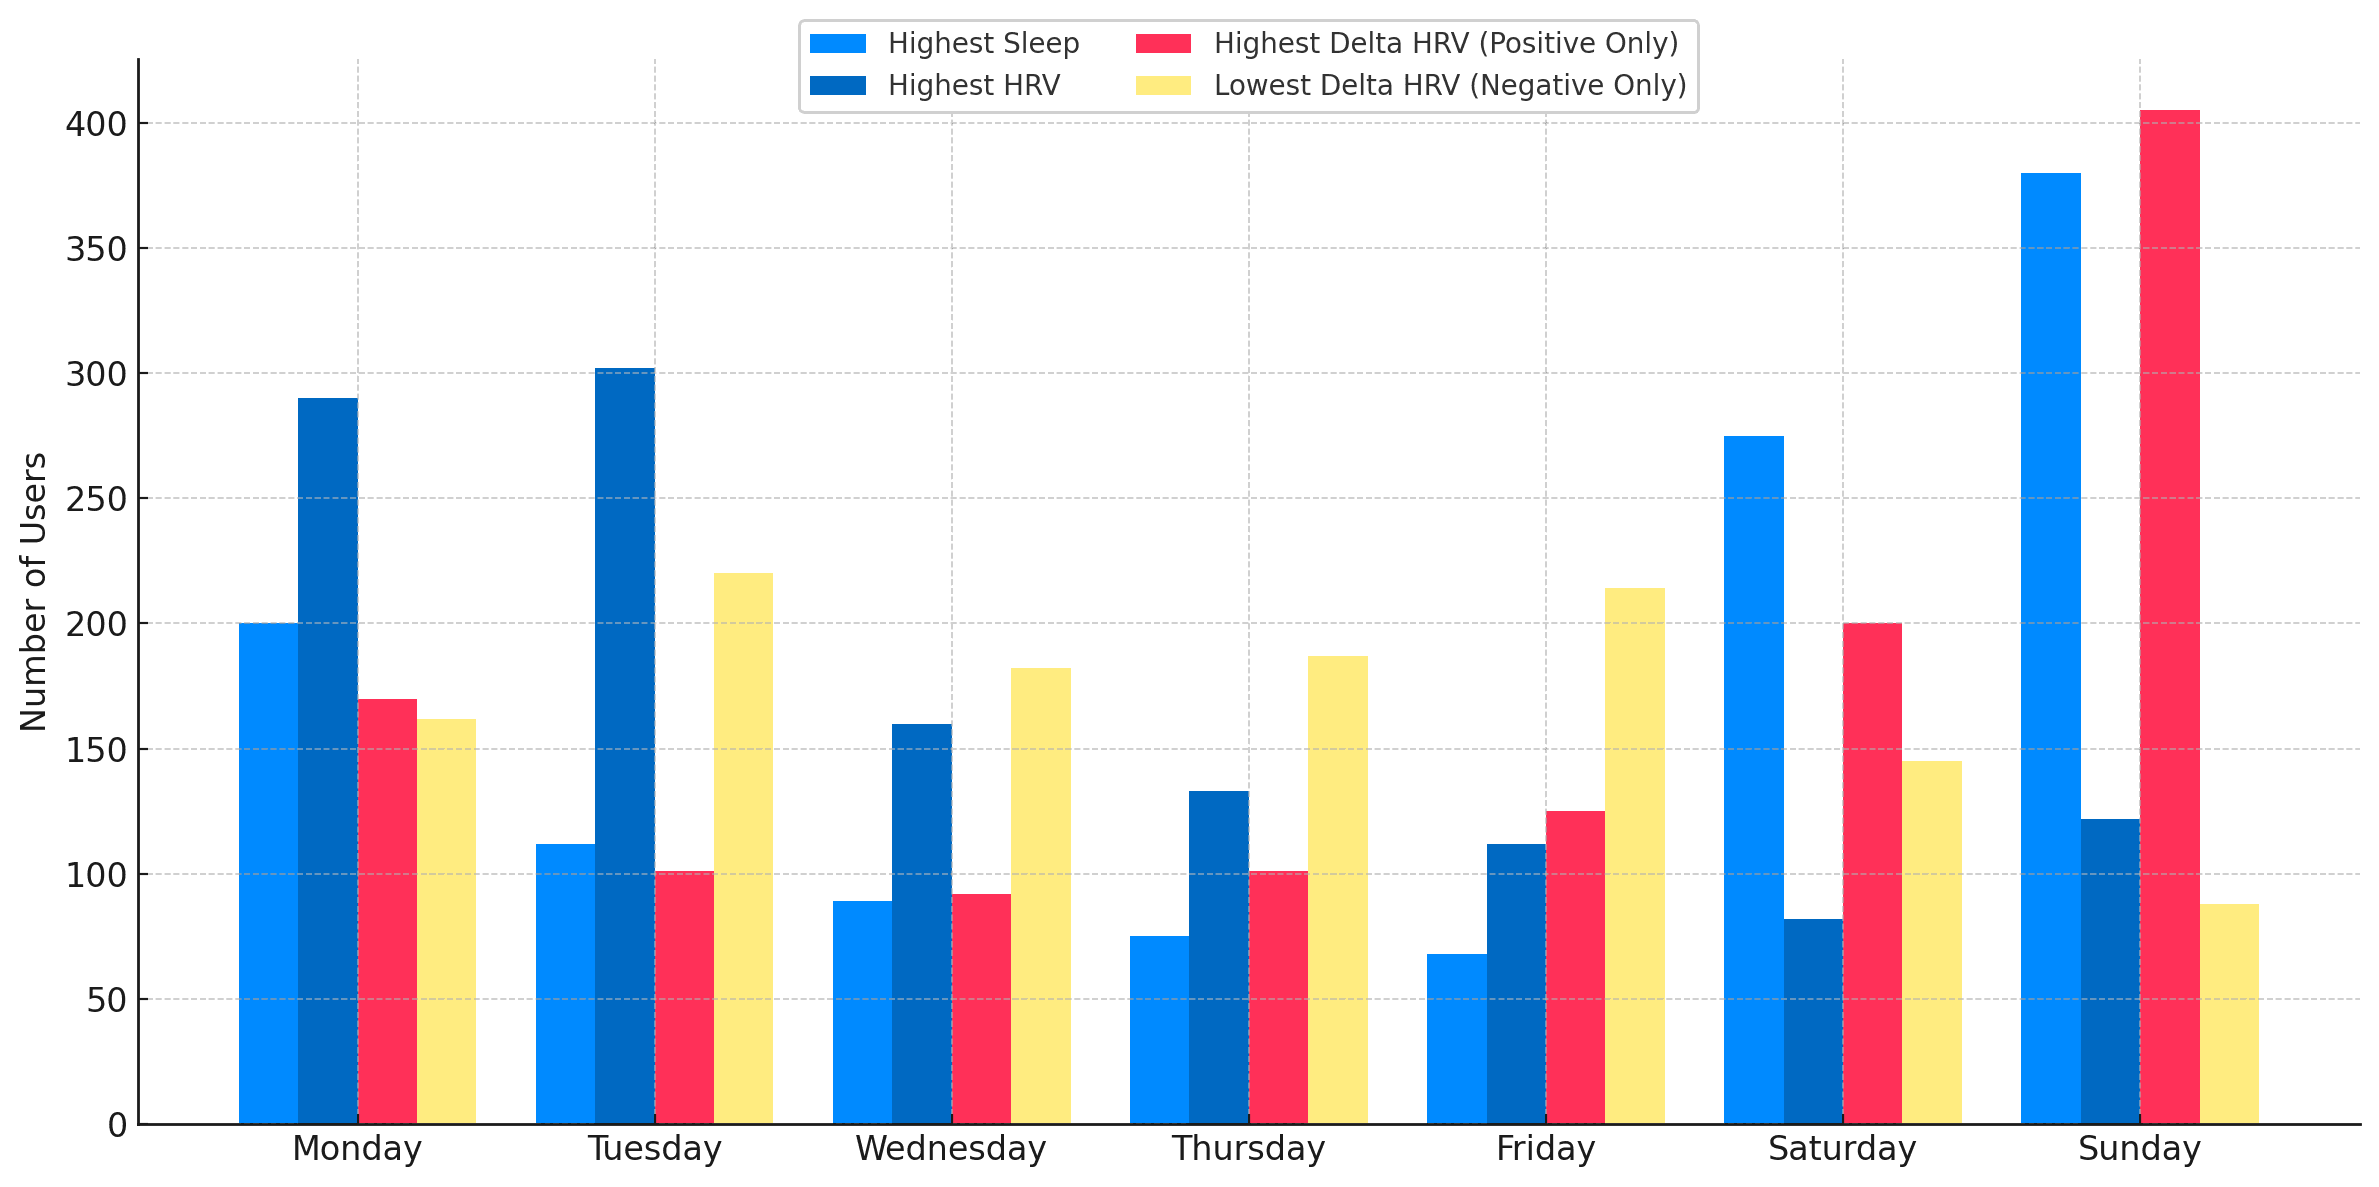
We also looked at how often people hit their personal highest or lowest HRV and sleep values on each day of the week.
Highest HRV by Day: Most common on Monday (295 users) and Tuesday (213)
Lowest HRV by Day: Most common on Sunday (293 users) and Saturday (253)
Highest Sleep by Day: Most common on Sunday (354 users) and Saturday (291)
Lowest Sleep by Day: Slightly more spread out, but Saturday (209) and Friday (196) lead
This confirms a simple but powerful (and some may say, obvious) insight: the weekend is when people try to recover, and early week is when their systems reflect this. But the weekend is when there is the most variability. We know this already, as it is when people have the most flexibility to choose how they sleep. We can chose to sleep and recover or enjoy ourselves on an evening!
Sleep Archetypes: Three Types of Sleepers
Next we clustered users into three groups based on their average sleep and how variable it was. This is both interesting and a way to start to model data by learning about types of user.
| Cluster | Description | Avg Sleep (h) | Std Dev (h) |
|---|---|---|---|
| 1 | Longer, more consistent | 7.74 | 0.96 |
| 0 | Average sleepers | 7.01 | 1.01 |
| 2 | Shorter, more variable | 6.23 | 1.07 |
Not surprisingly, these groups showed differences in HRV:
| Cluster | Mean HRV (ms) | Std HRV (ms) |
|---|---|---|
| 1 | 45.01 | 11.01 |
| 0 | 44.12 | 10.12 |
| 2 | 42.03 | 9.03 |
A statistical test (ANOVA) confirmed these differences were significant. The longer, more consistent sleepers had the highest HRV, and the short, inconsistent sleepers had the lowest. This isn’t groundbreaking, we expect better sleep to accompany higher parasympathetic activity.
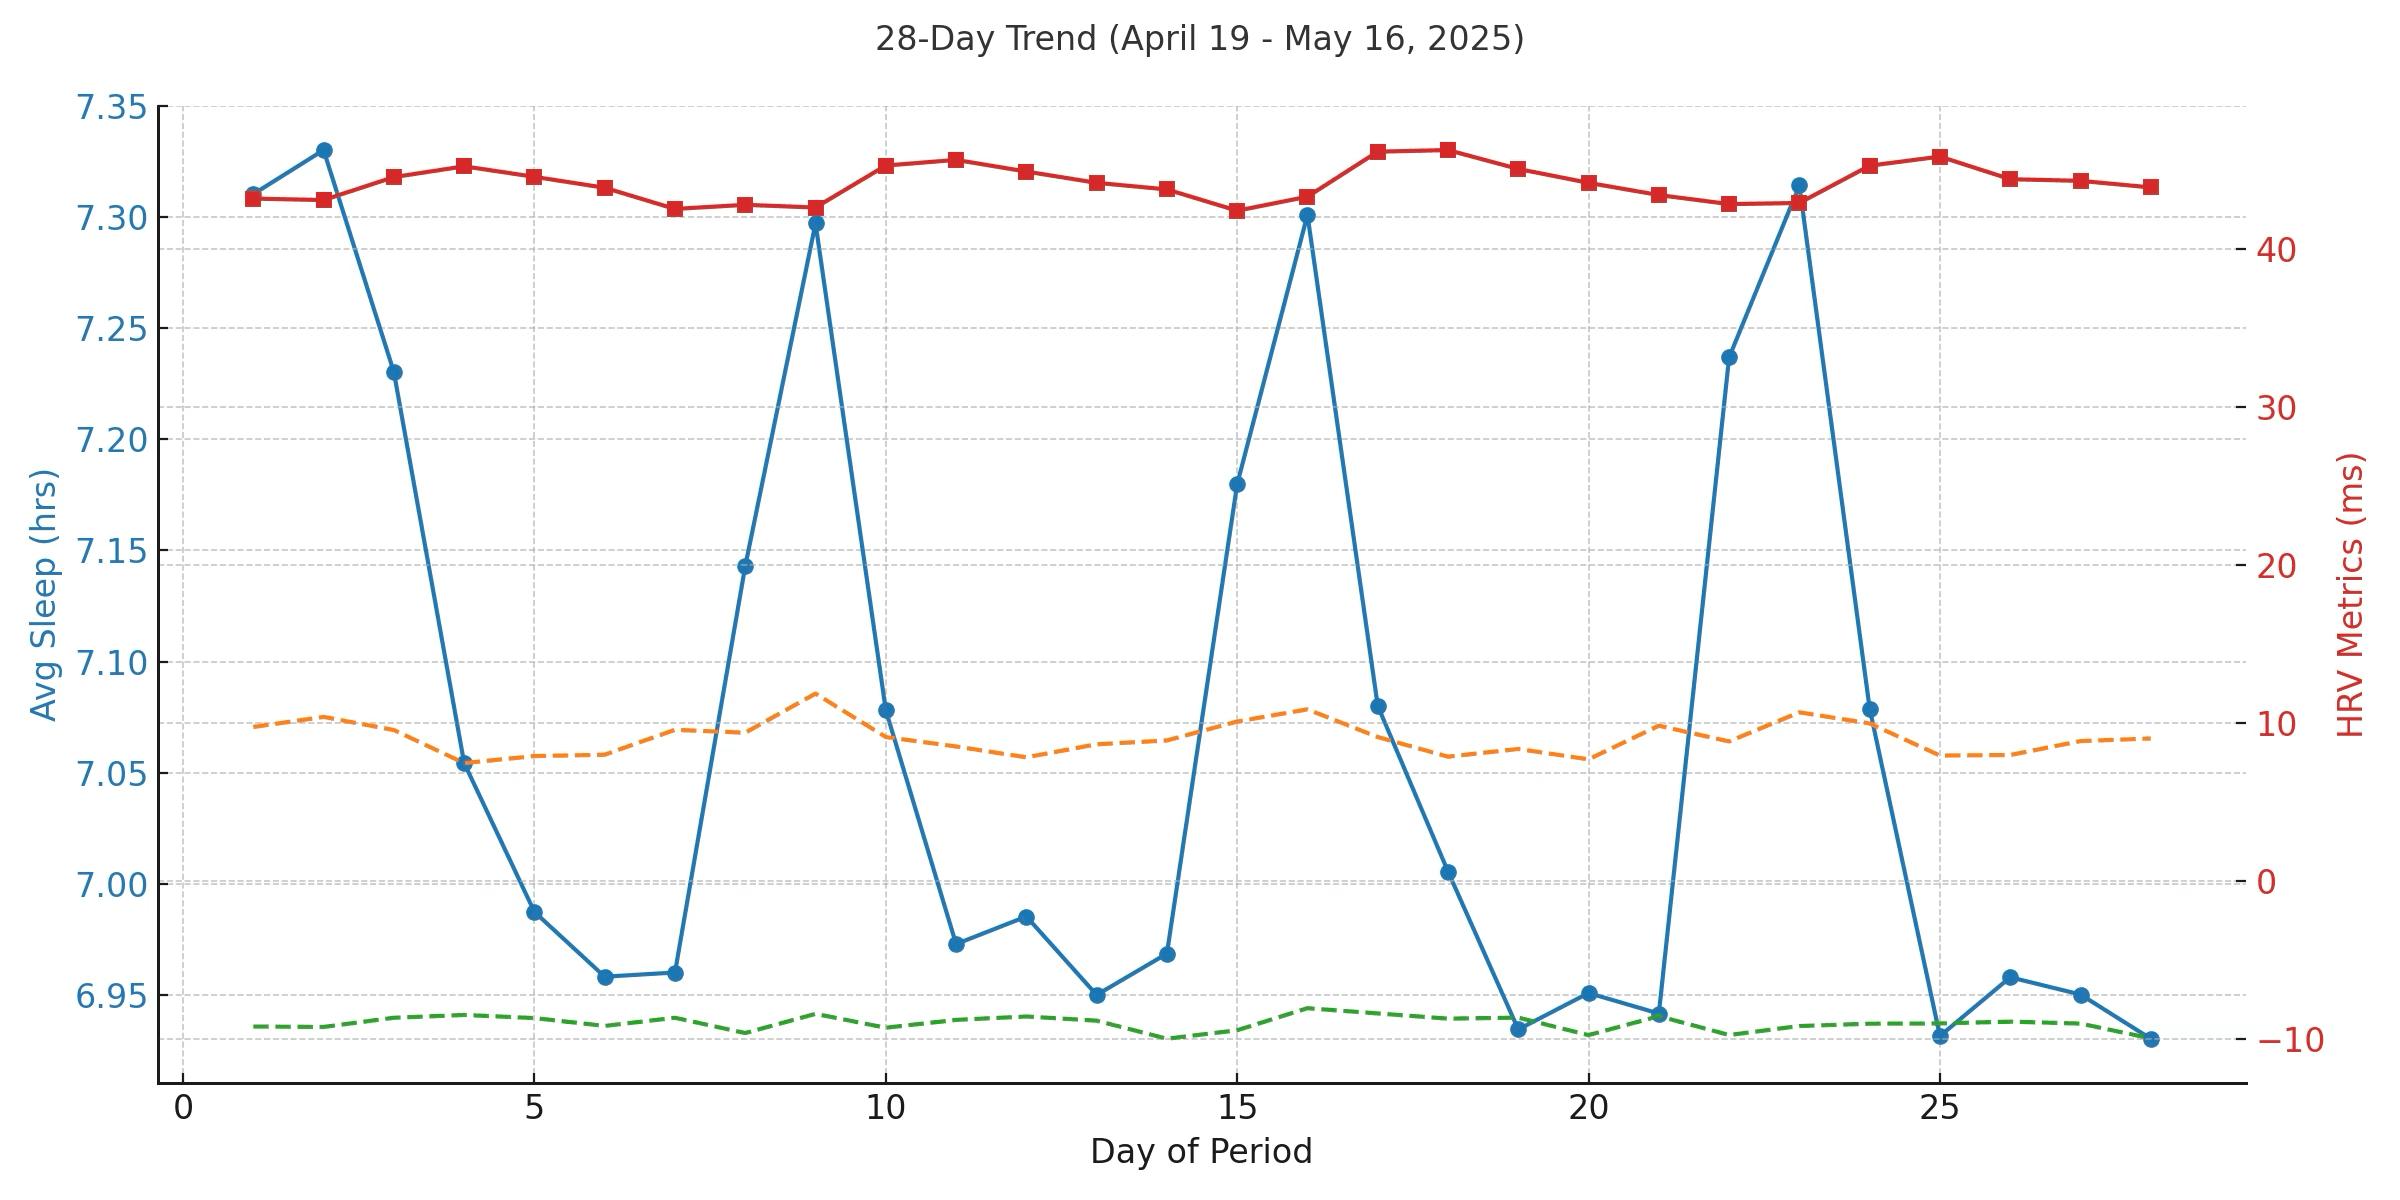
Zooming Out: A 28-Day Trend
We also looked at 28 days of rolling trends, from April 19 to May 16, 2025, to see how these metrics evolved over time. Check out figure 3 to see how these patterns play out over a four week cycle. From a trend perspective over the 28 days:
- Sleep duration showed a very slight decrease: -0.0061 hours/day
- HRV showed a slight increase: +0.0248 ms/day
- Positive delta HRV declined: -0.0130 ms/day
- Negative delta HRV declined: -0.0125 ms/day
This suggests people may have been sleeping slightly less but experiencing slightly more stable recovery. We don’t know the location of the users, but its a good bet that most of them are in the northern hemisphere, and sleep less as the days get longer. We also see an increase in mean HRV with decreased deltas in both directions (variability). This could also be a seasonal effect.
So What Do We Take From This
Firstly, on average HRV rebounds early in the week. Don’t write off Mondays. They might be the most biologically resilient day we have! Secondly, sleep habits matter and it’s not just how much we sleep, but how consistently. Thirdly, the weekend is for recovery, but that recovery may not show up immediately. We can learn a lot from our patterns, not just our averages. Look at trends, not just snapshots. If your HRV is tanking on Sunday, it might be time to think about taking it a bit easier over the weekend (whatever that means for you!)
Over the next few weeks we will be analysing all the data we can find and publishing all of the insights. Is there anything you’d like to see?
Summary
- Why is my HRV actually highest on Mondays even though I dread them?
- Across more than 1,000 wearable users, average HRV peaked on Monday at 45.55 ms with a positive delta of +3.18 ms versus Sunday — by far the largest day-over-day jump of the week. The likely explanation is that weekend recovery doesn't register immediately; the parasympathetic benefit of extra sleep on Saturday and Sunday nights shows up a day or two later. Biologically, Monday may be your most resilient day of the week, even if it doesn't feel that way.
- How much do people actually sleep, and how much does it vary?
- In the 28-day analysis of 1,000+ users, average sleep duration was 7.06 hours with a standard deviation of 1.19 hours, and mean overnight HRV was 44.19 ms with a large standard deviation of 26.81 ms. That spread is the real story — people vary enormously in both how long they sleep and how their autonomic nervous system responds. Population averages hide huge individual differences.
- Why doesn't a weekend lie-in immediately fix my recovery?
- The data shows people sleep the most on Saturday (7.18 h) and Sunday (7.28 h) nights, yet HRV bottoms out on those same days at 42.48 and 42.37 ms respectively. HRV reflects cumulative load, not just last night's sleep, so a single long sleep can't undo a week's worth of accumulated strain. Recovery lags — the payoff tends to land on Monday or Tuesday.
- Does sleep consistency matter more than sleep duration?
- Both matter, and they travel together. When users were clustered into three groups, the longer-and-more-consistent sleepers (7.74 h average, 0.96 h std dev) had the highest mean HRV at 45.01 ms, while shorter-and-more-variable sleepers (6.23 h, 1.07 h std dev) had the lowest at 42.03 ms — a difference confirmed significant by ANOVA. Stable sleep patterns are linked to stronger parasympathetic activity, not just more hours in bed.
- When am I most likely to hit my personal worst HRV?
- On the weekend. Sunday was the most common day for users' lowest HRV (293 users), followed by Saturday (253 users). Meanwhile, personal-best HRV clustered on Monday (295 users) and Tuesday (213 users). The weekend is when behavioral variability is highest — people choose between recovery and indulgence — and the nervous system reflects those choices.
- Can wearable data really detect weekly recovery patterns at population scale?
- Yes. Aggregating sleep duration and overnight HRV across 1,000+ users over 28 days surfaced a clear weekly rhythm: HRV climbed early in the week, declined steadily through Friday, and bottomed out on the weekend before rebounding. These patterns wouldn't be visible in any single user's noisy daily data, but population-level wearable analysis makes them obvious.
- Are there any longer-term trends in sleep and HRV over the month?
- Across April 19 to May 16, 2025, sleep duration drifted down very slightly (-0.0061 hours/day) while mean HRV rose modestly (+0.0248 ms/day), with both positive and negative HRV deltas shrinking (-0.0130 and -0.0125 ms/day). That points to slightly less sleep but more stable recovery — plausibly a seasonal effect as days lengthened in the northern hemisphere.
- What should I actually change based on these findings?
- Stop judging your week by Monday morning grogginess — biologically it's often your strongest recovery day. Focus on sleep consistency rather than chasing one big catch-up night, since the most consistent sleepers had measurably higher HRV. And if your HRV is tanking by Sunday, that's a signal your weekend load is too high, not that your weekday training is failing you.
Continue reading
Running
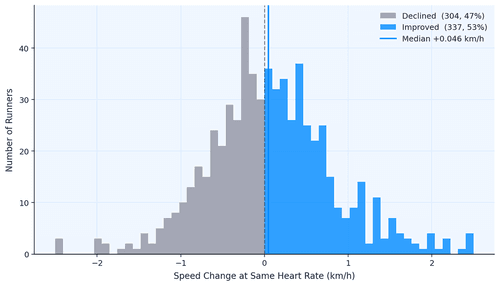
Data Shows Most Runners Don't Actually Get Faster
How do runners actually get faster? We analyzed 856,000 running activities to find out who actually gets faster. It wasn't the intense ones, but rather the consistent ones. Showing up month after month beat everything flashier. Boring, as it turns out, is fast.
May 7, 2026

Marathon Series
The Data Behind the London Marathon
While Sabastian Sawe was busy breaking the two-hour marathon barrier in London, the watches of 571 amateur runners told a quieter but equally fascinating story. GPS devices over-measured the course by 527 metres on average, faster runners ran with higher heart rates than the slower ones did, and Coros watches reported 47% more calories per kilometre than physiology actually supports.
April 27, 2026

London Data
Tube Strikes Made Londoners Active
During the April 2026 Tube strikes, Londoners adapted by cycling more—activity tripled, e-bike commutes rose 13%, and 19% of cyclists were entirely new to riding. Data analysis of 1,566 weekday rides revealed e-bike share jumped from 54.9% to 67.5%, with commutes often staying local. The strikes disrupted transit but highlighted Londoners' resilience in finding alternative ways to move.
April 24, 2026

Endurance Training
Running Is The Hardest Endurance Sport? Not so Fast
Which sport is hardest on the heart? We ran the question through hundreds of thousands of sessions across nine activity types. Running dominates minute-for-minute. It has the highest average, highest peak, highest sustained intensity. But its shorter sessions mean total cardiovascular load per outing often falls behind skiing or hiking. The shape of the heart rate curve tells a different story for every sport, and the weighting method you pick changes the answer.
April 23, 2026