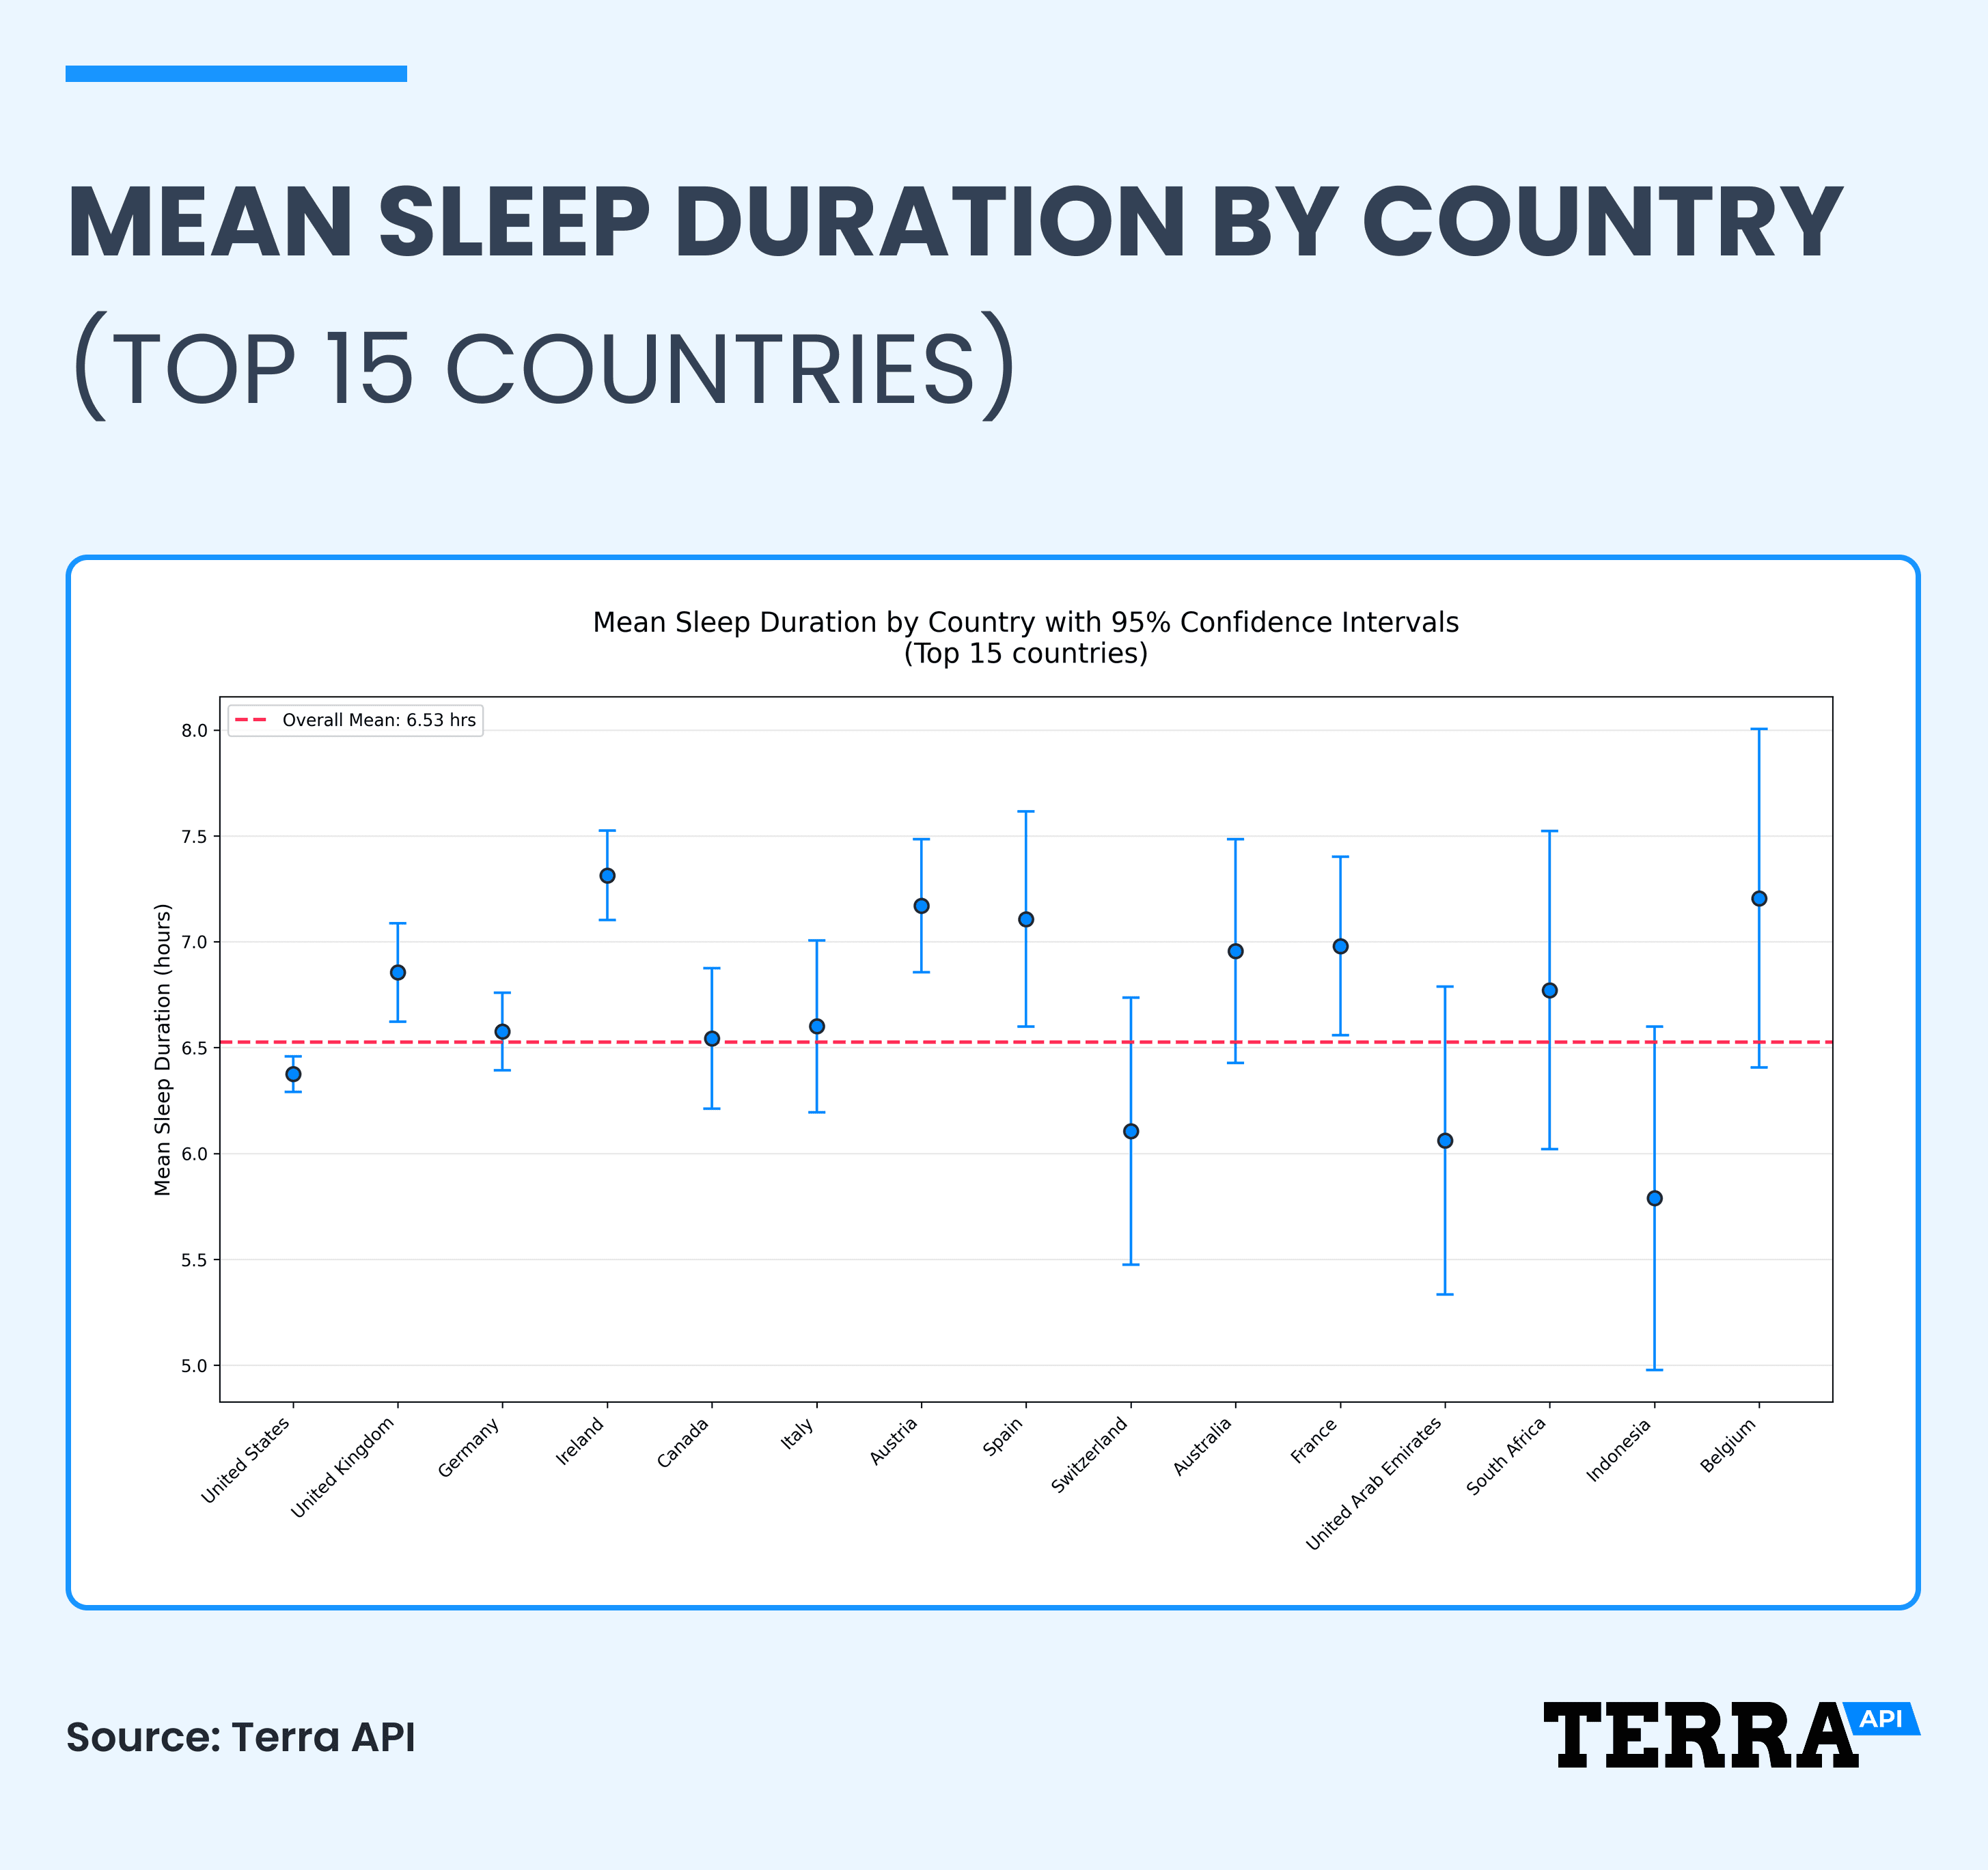
Sleep length varies greatly by geographic location. In October 2025, average sleep ranged from ~7.3 hours in Ireland to ~5.8 hours in Indonesia — a gap of more than 90 minutes within the same month.
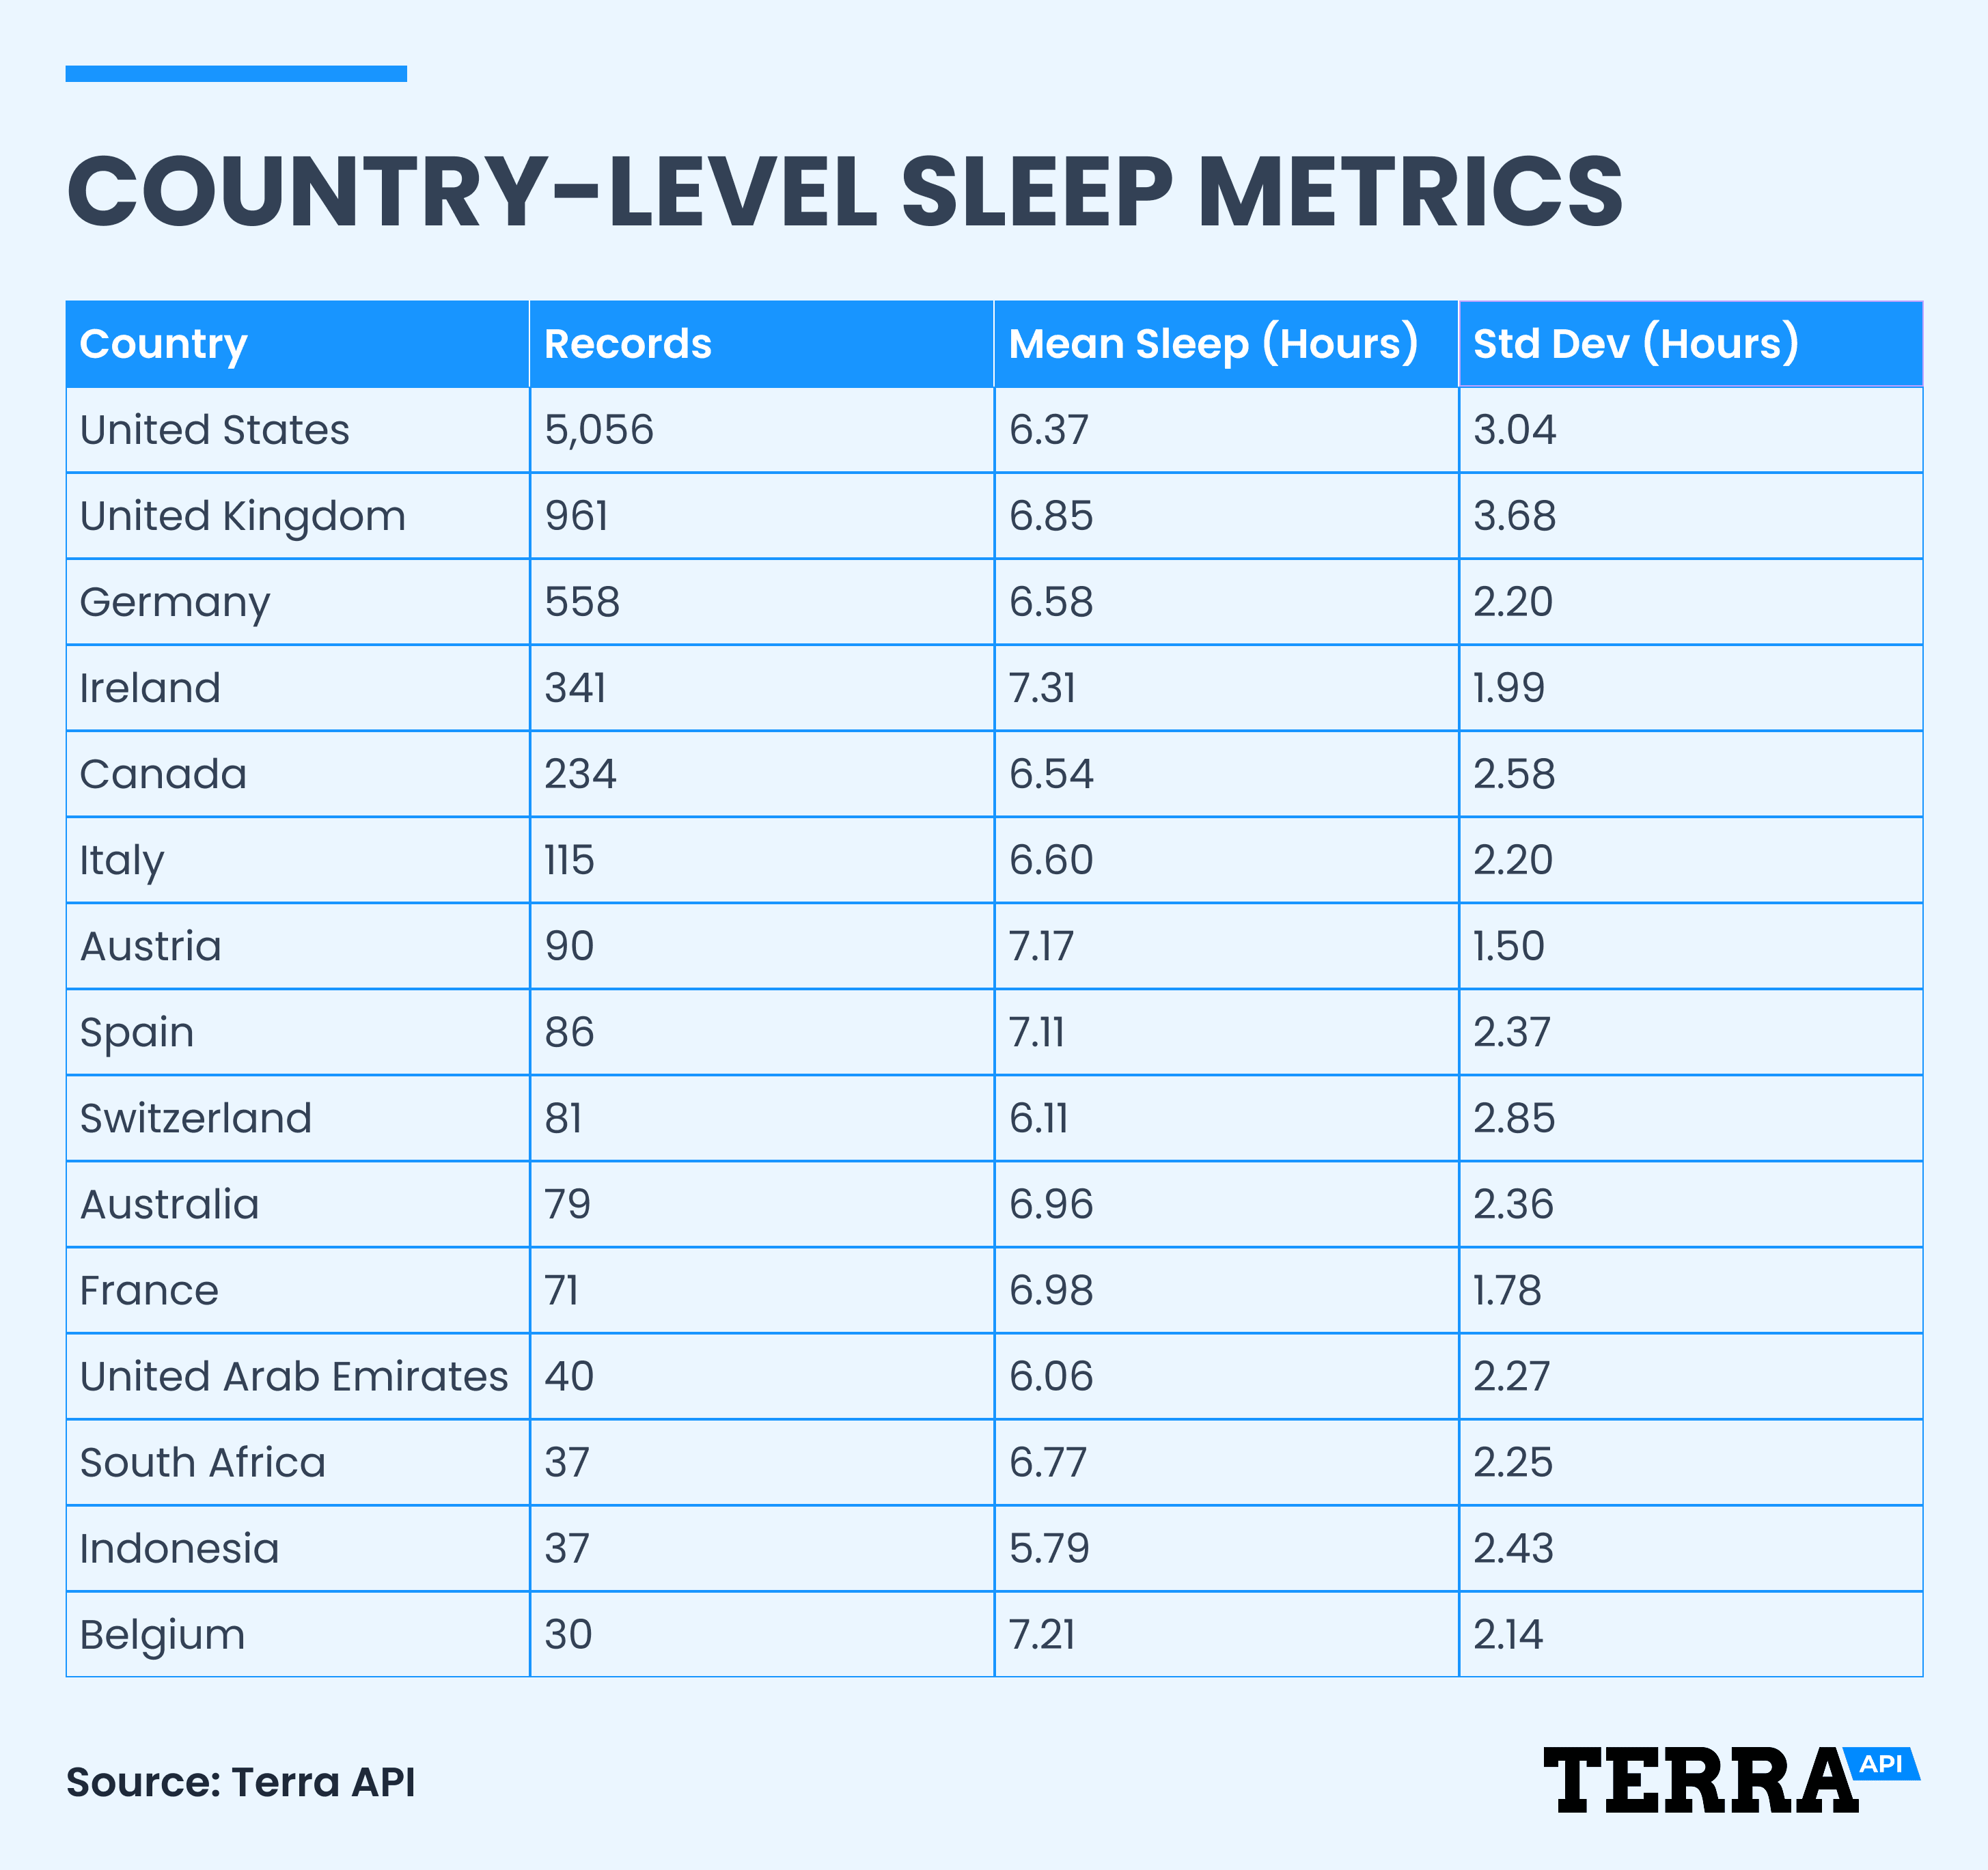
Sleep regularity ≠ duration. Night-to-night variability differs sharply by country, with the UK (~3.7h Standard Deviation) and US (~3.0h Standard Deviation) far less consistent than Austria (~1.5h SD) and Ireland (~2.0h SD).
Weekends shift sleep, but is highly location dependent. In this dataset, U.S. users slept ~0.26 hours less on weekends, while Italy trended ~0.5 hours more, hinting at contrasting “social clocks.”
Sleep Tracking
Sleep Patterns Across the World
We analyzed 8,298 sleep records from October 2025 across wearable users in North America, Europe, and beyond, linking exercise locations to approximate where people slept. Ireland topped the charts at 7.31 hours with minimal variability, while Indonesia showed the shortest, most variable nights at 5.79 hours. The data reveals how geography, culture, and seasonality shape nightly rest—with Northern Hemisphere countries sleeping longer in autumn while Southern Hemisphere nations showed spring patterns pulling duration down. These population-level insights help refine health models and establish accurate baselines for personalized sleep tracking across borders.
Alistair BrownleeHead of Research
Faraaz AkhtarAI and Health Researcher
Halvard RamstadEditor-in-Chief
January 6, 2026
Key takeaways
Where you sleep determines how much you sleep
At Terra Research, we harness wearable insights from devices like Fitbit, and Apple Watch to forge meaningful connections between daily activities and long-term wellness. This week we explored our latest anonymised dataset: 8,298 sleep records from October 25, 2025.
By linking each user's last known exercise location to their subsequent sleep session, we approximate geographic influences on rest, acknowledging potential inaccuracies from travel but leveraging it as a robust proxy for nightly patterns. As always, ideally, we would have the exact location of the sleep event, but to do that, we would be sacrificing the size and the privacy of the dataset.
This analysis reveals how borders shape bedtime, with implications for personalised health models. We'll spotlight top countries, dive into average durations and variabilities, and highlight intriguing weekday-weekend shifts. We are looking at population-level statistics here, and as we’ve discussed in previous blogs, sleep is impacted by a wide range of variables.
Dataset Overview: A Worldwide Night's Rest
Our October 2025 snapshot captures a diverse user base, primarily from North America and Europe, reflecting Terra's footprint. We used the geolocation of the last exercise session of that day and presume that's the same location of that night’s sleep. While not infallible (e.g., post-workout flights could offset accuracy), it's a practical lens for global trends for a large dataset.
The key metrics include mean sleep duration (hours) and standard deviation (variability), aggregated by country. Overall, averages hover around 6-7 hours, aligning with health guidelines but underscoring opportunities for improvement.
Get the latest Terra Research reports and insights every week as soon as they're published.
By continuing, I agree to the Privacy Policy and Terms of Service.

Country-Level Sleep Metrics: Duration and Consistency
We computed means and standard deviations for all countries with notable records. Ireland tops the charts with over 7 hours, while emerging markets like Indonesia show shorter, more variable nights, potentially tied to urban hustle or equatorial light cycles.
We don’t know how many users these records belong to; for countries with low values, they could come from only one user. Consequently, the mean may reflect the habits of only one user. The table below shows the results for the 15 countries with the highest records.
Seasonal Considerations: Hemisphere Differences in October Sleep
Research indicates that populations tend to sleep less during summer months, with studies showing an average reduction of about 12 minutes compared to winter, often due to longer daylight hours and higher temperatures disrupting circadian rhythms.
This seasonal effect can influence interpretations of our October data, particularly across hemispheres. In the Northern Hemisphere (e.g., US, UK, Germany), October marks autumn, with cooler weather and shorter days potentially promoting longer sleep—evident in higher averages, such as Ireland's 7.31 hours and Norway's 7.18 hours.
Conversely, in the Southern Hemisphere (e.g., Australia, South Africa, New Zealand), October is spring, transitioning toward summer conditions that may begin to curtail sleep durations. Here, we see mixed but generally solid figures, such as New Zealand's leading 7.44 hours and Australia's 6.96 hours, though lower than some Northern counterparts.
Equatorial regions like Indonesia (5.79 hours) show even shorter sleep, less affected by seasonal swings but impacted by consistent heat. These hemispheric nuances highlight the need for health models to incorporate seasonal adjustments for accurate global benchmarking.
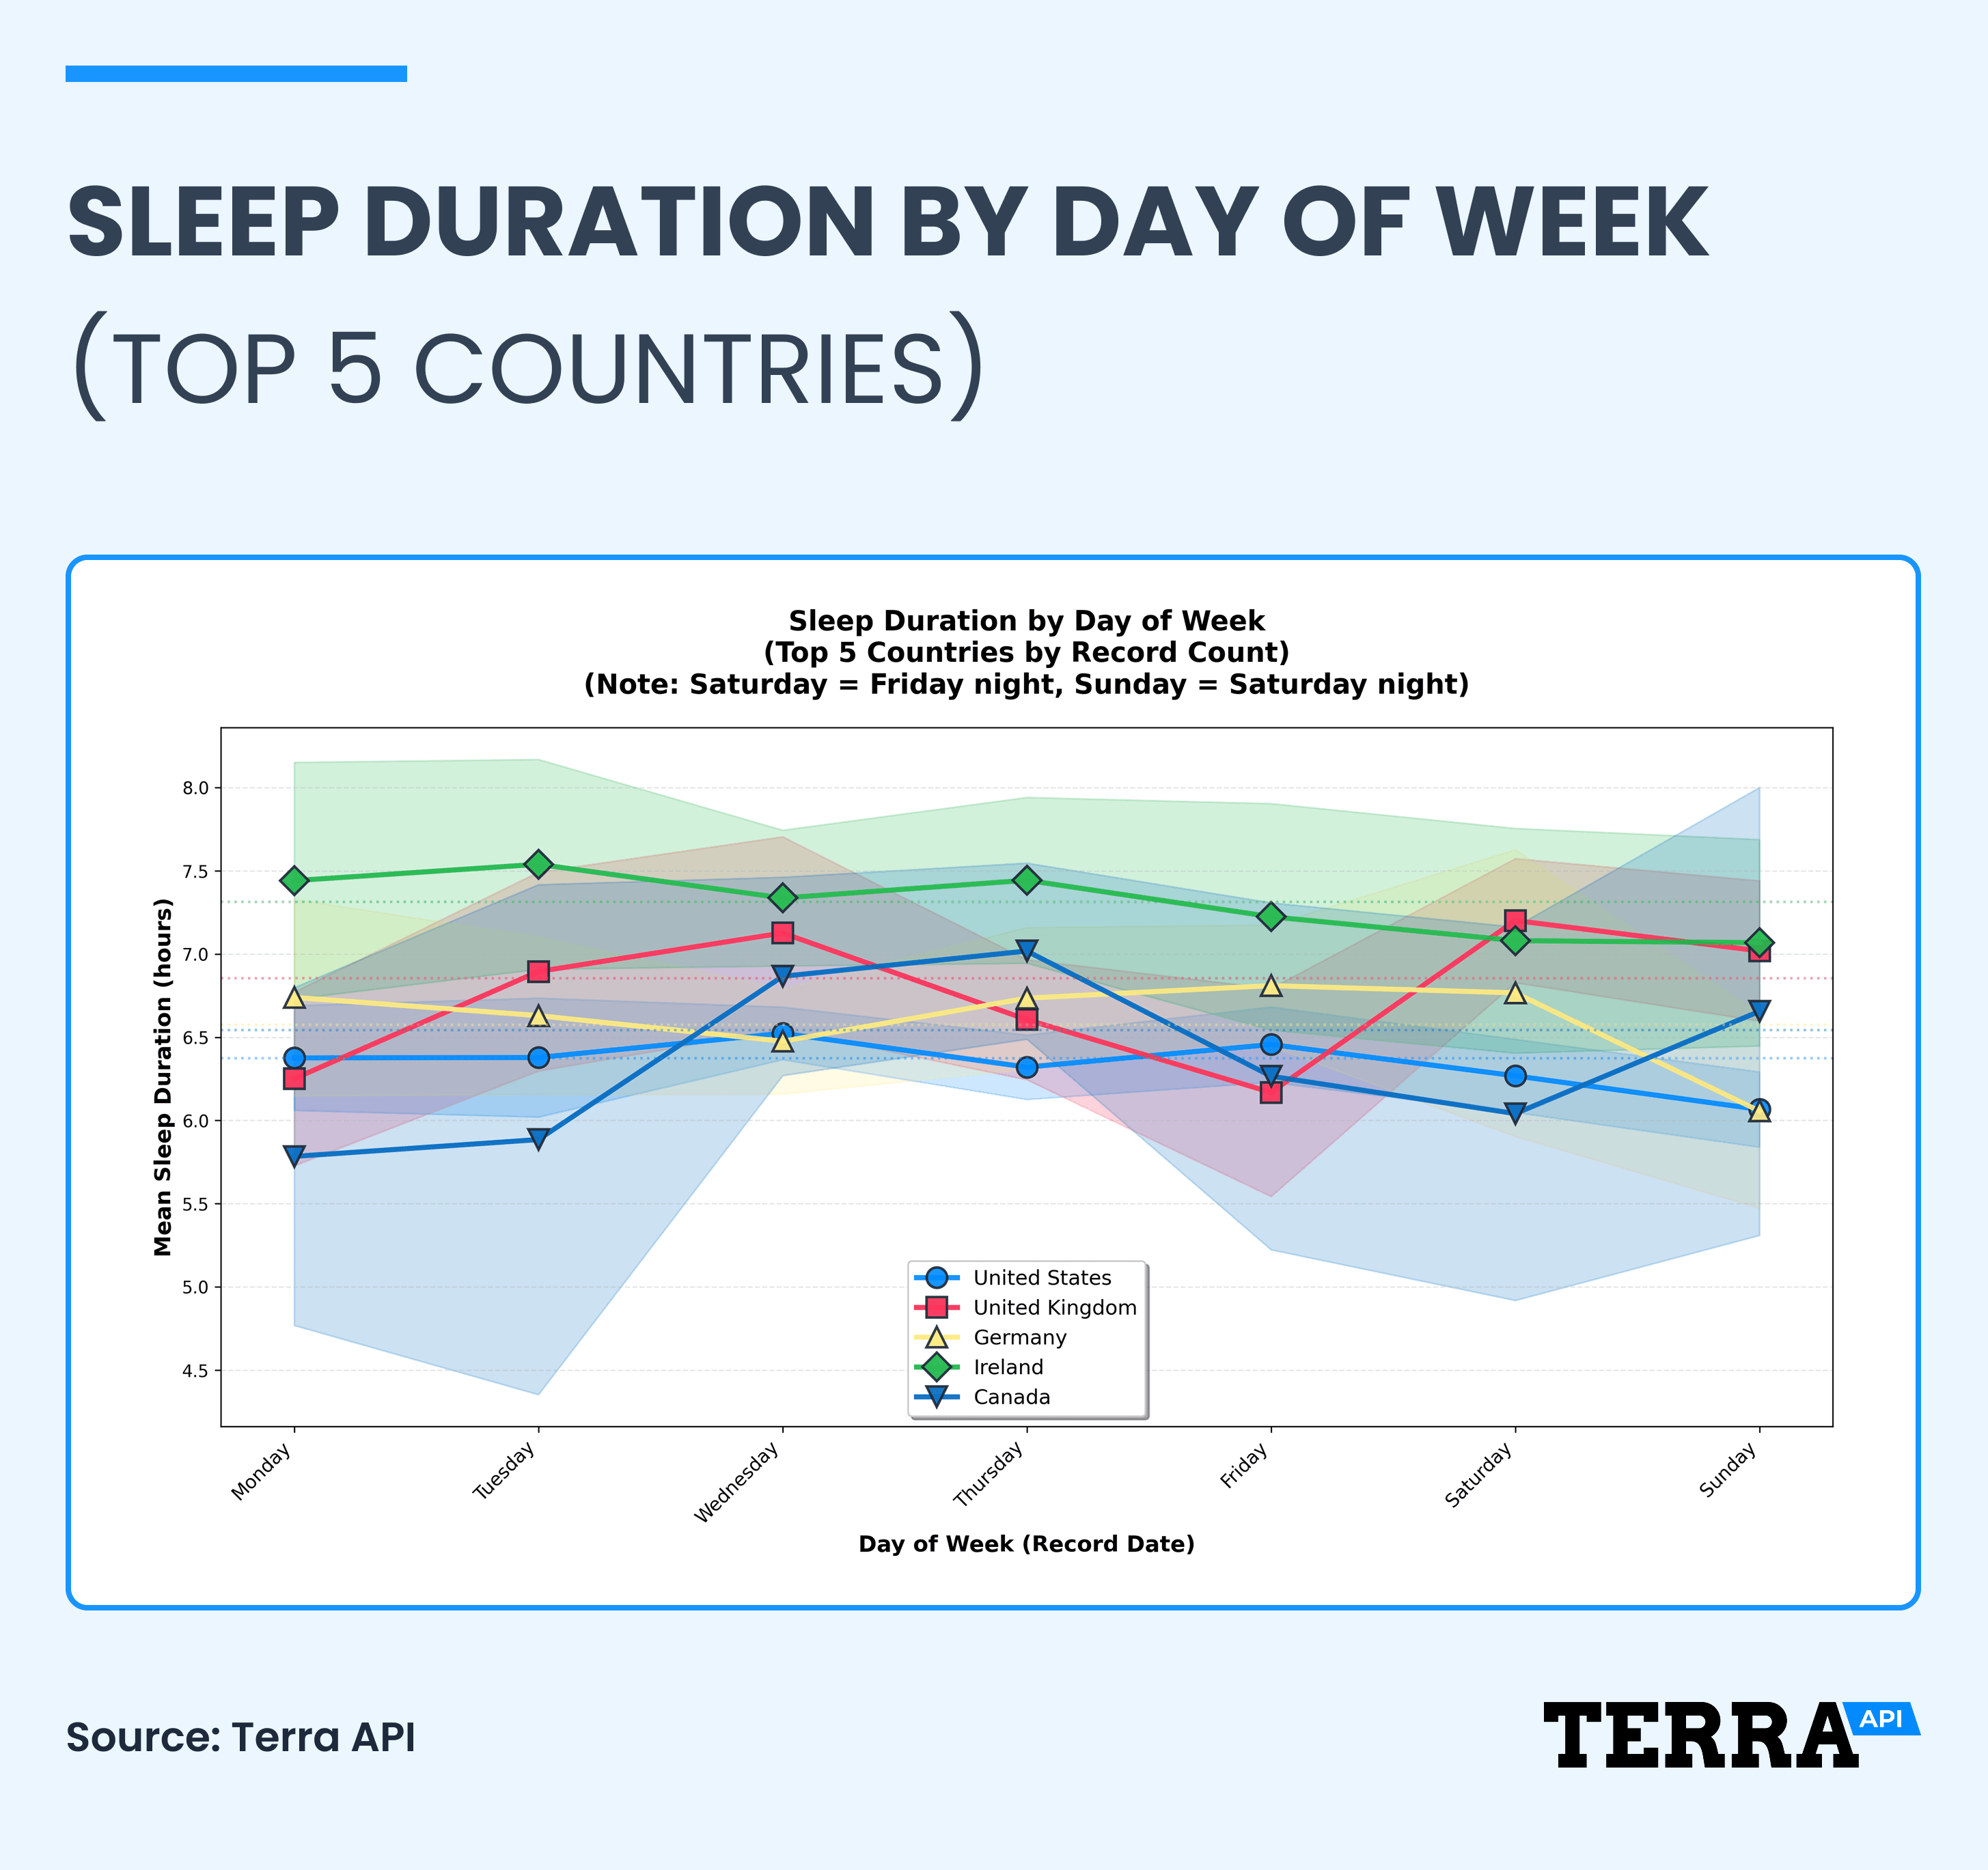
We partitioned data into weekday (Sunday-Thursday) and weekend (Friday-Saturday) nights to detect "social jet lag." Globally, weekends extend sleep slightly, but nuances emerge:
- United States: A significant -0.26 hours drop on weekends, possibly from nightlife or screen time, informing Terra's fatigue risk models.
- Italy: A +0.51 hours uptick (non-significant). Is this Mediterranean leisurely weekend?
Research Relevance: Establishing Norms for Better Health Modeling
At Terra Research, analyses like this are foundational to our research mission. By mapping population-level sleep norms across geographies, we gain a deeper understanding of "typical" rest patterns and what constitutes a healthy baseline in diverse contexts. This allows us to benchmark individual users against these norms, flagging deviations that might signal emerging health issues.
Moreover, it enables advanced phenotyping: clustering users into sleep "types" based on duration, variability, and cultural influences. We will continue to develop these phenotypes to power our machine learning models, from predicting recovery needs to tailoring interventions. Ultimately, it's about turning aggregated wearable data into personalised, proactive health insights.
In the future, we want to run a much larger location-based sleep study, with year-round records for each individual, to help us better understand genuine relationships. This provided a helpful first step to see if our model of using exercise location could work.
[1] Mattingly, Scott M., Tushar Grover, Gabriel J. Martinez, et al. “The Effects of Seasons and Weather on Sleep Patterns Measured through Longitudinal Multimodal Sensing.” npj Digital Medicine, vol. 4, 2021, article 76, https://doi.org/10.1038/s41746-021-00435-2.
Summary
- How much do people actually sleep around the world?
- Across 8,298 sleep records from October 25, 2025, global averages hovered around 6-7 hours per night. Ireland led at 7.31 hours and New Zealand topped the table at 7.44 hours, while Indonesia came in lowest at just 5.79 hours. Most populations are landing near the lower end of clinical sleep guidelines — meeting the floor, but rarely the ideal.
- Why do people in equatorial countries sleep less?
- Indonesia averaged only 5.79 hours per night, well below Northern European countries like Ireland (7.31h) and Norway (7.18h). Equatorial regions don't experience the seasonal daylight shifts that lengthen sleep in autumn, and consistent heat appears to suppress duration year-round. Geography — specifically latitude and climate — is a measurable input to sleep, not just culture.
- Do I really sleep more on weekends?
- It depends heavily on where you live. In the United States, weekend sleep actually dropped by 0.26 hours compared to weekdays, likely driven by nightlife and screen time. Italy showed the opposite pattern with a +0.51 hour weekend increase. The 'social jet lag' assumption that weekends mean more rest doesn't hold universally.
- Does the season I'm in change how much I sleep?
- Yes — research cited in the analysis shows people sleep about 12 minutes less in summer than in winter due to longer daylight and higher temperatures. This shows up clearly in the October dataset: Northern Hemisphere countries entering autumn (Ireland 7.31h, Norway 7.18h) outsleep Southern Hemisphere countries entering spring (Australia 6.96h). Any global sleep benchmark needs to adjust for hemisphere and season to be meaningful.
- Can wearable data really capture sleep patterns by country?
- Yes, with caveats. By linking each user's last known exercise location to their subsequent sleep session across 8,298 records, geographic sleep patterns emerged clearly enough to differentiate countries by hours and variability. The method trades pinpoint accuracy (post-workout travel can offset location) for dataset scale and privacy — a practical compromise that still surfaces robust population-level signals.
- Which country sleeps the most, and which sleeps the least?
- In the October 2025 snapshot, New Zealand led with 7.44 hours and Ireland followed at 7.31 hours, while Indonesia trailed at 5.79 hours. That's a gap of more than 1.6 hours per night between top and bottom — a substantial difference when compounded across weeks. Where you live appears to shape nightly rest as much as many individual lifestyle factors.
- Why does my country's average matter for my own sleep?
- Population norms are the baseline against which individual deviations become meaningful. Knowing that the US weekend pattern shows a 0.26-hour drop, or that Indonesian averages sit near 5.79 hours, lets health models flag when your personal data diverges from your geographic peer group. Without local norms, 'healthy sleep' is a one-size-fits-all number that ignores climate, daylight, and culture.
- Should I worry if my sleep average is below 7 hours?
- Not automatically — global averages sit in the 6-7 hour range, so being slightly under 7 hours puts you in line with most of the world. What matters more is variability and context: your hemisphere, season, and weekday-weekend pattern. The data suggests benchmarking against your country and time of year is more useful than chasing a universal 8-hour target.
Continue reading
Running
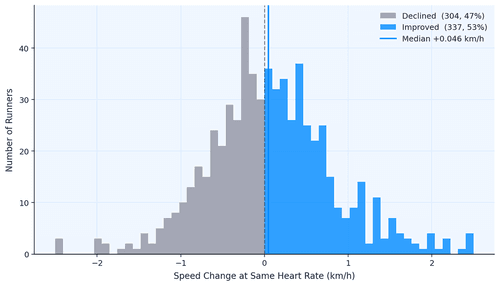
Data Shows Most Runners Don't Actually Get Faster
How do runners actually get faster? We analyzed 856,000 running activities to find out who actually gets faster. It wasn't the intense ones, but rather the consistent ones. Showing up month after month beat everything flashier. Boring, as it turns out, is fast.
May 7, 2026

Marathon Series
The Data Behind the London Marathon
While Sabastian Sawe was busy breaking the two-hour marathon barrier in London, the watches of 571 amateur runners told a quieter but equally fascinating story. GPS devices over-measured the course by 527 metres on average, faster runners ran with higher heart rates than the slower ones did, and Coros watches reported 47% more calories per kilometre than physiology actually supports.
April 27, 2026

London Data
Tube Strikes Made Londoners Active
During the April 2026 Tube strikes, Londoners adapted by cycling more—activity tripled, e-bike commutes rose 13%, and 19% of cyclists were entirely new to riding. Data analysis of 1,566 weekday rides revealed e-bike share jumped from 54.9% to 67.5%, with commutes often staying local. The strikes disrupted transit but highlighted Londoners' resilience in finding alternative ways to move.
April 24, 2026

Endurance Training
Running Is The Hardest Endurance Sport? Not so Fast
Which sport is hardest on the heart? We ran the question through hundreds of thousands of sessions across nine activity types. Running dominates minute-for-minute. It has the highest average, highest peak, highest sustained intensity. But its shorter sessions mean total cardiovascular load per outing often falls behind skiing or hiking. The shape of the heart rate curve tells a different story for every sport, and the weighting method you pick changes the answer.
April 23, 2026