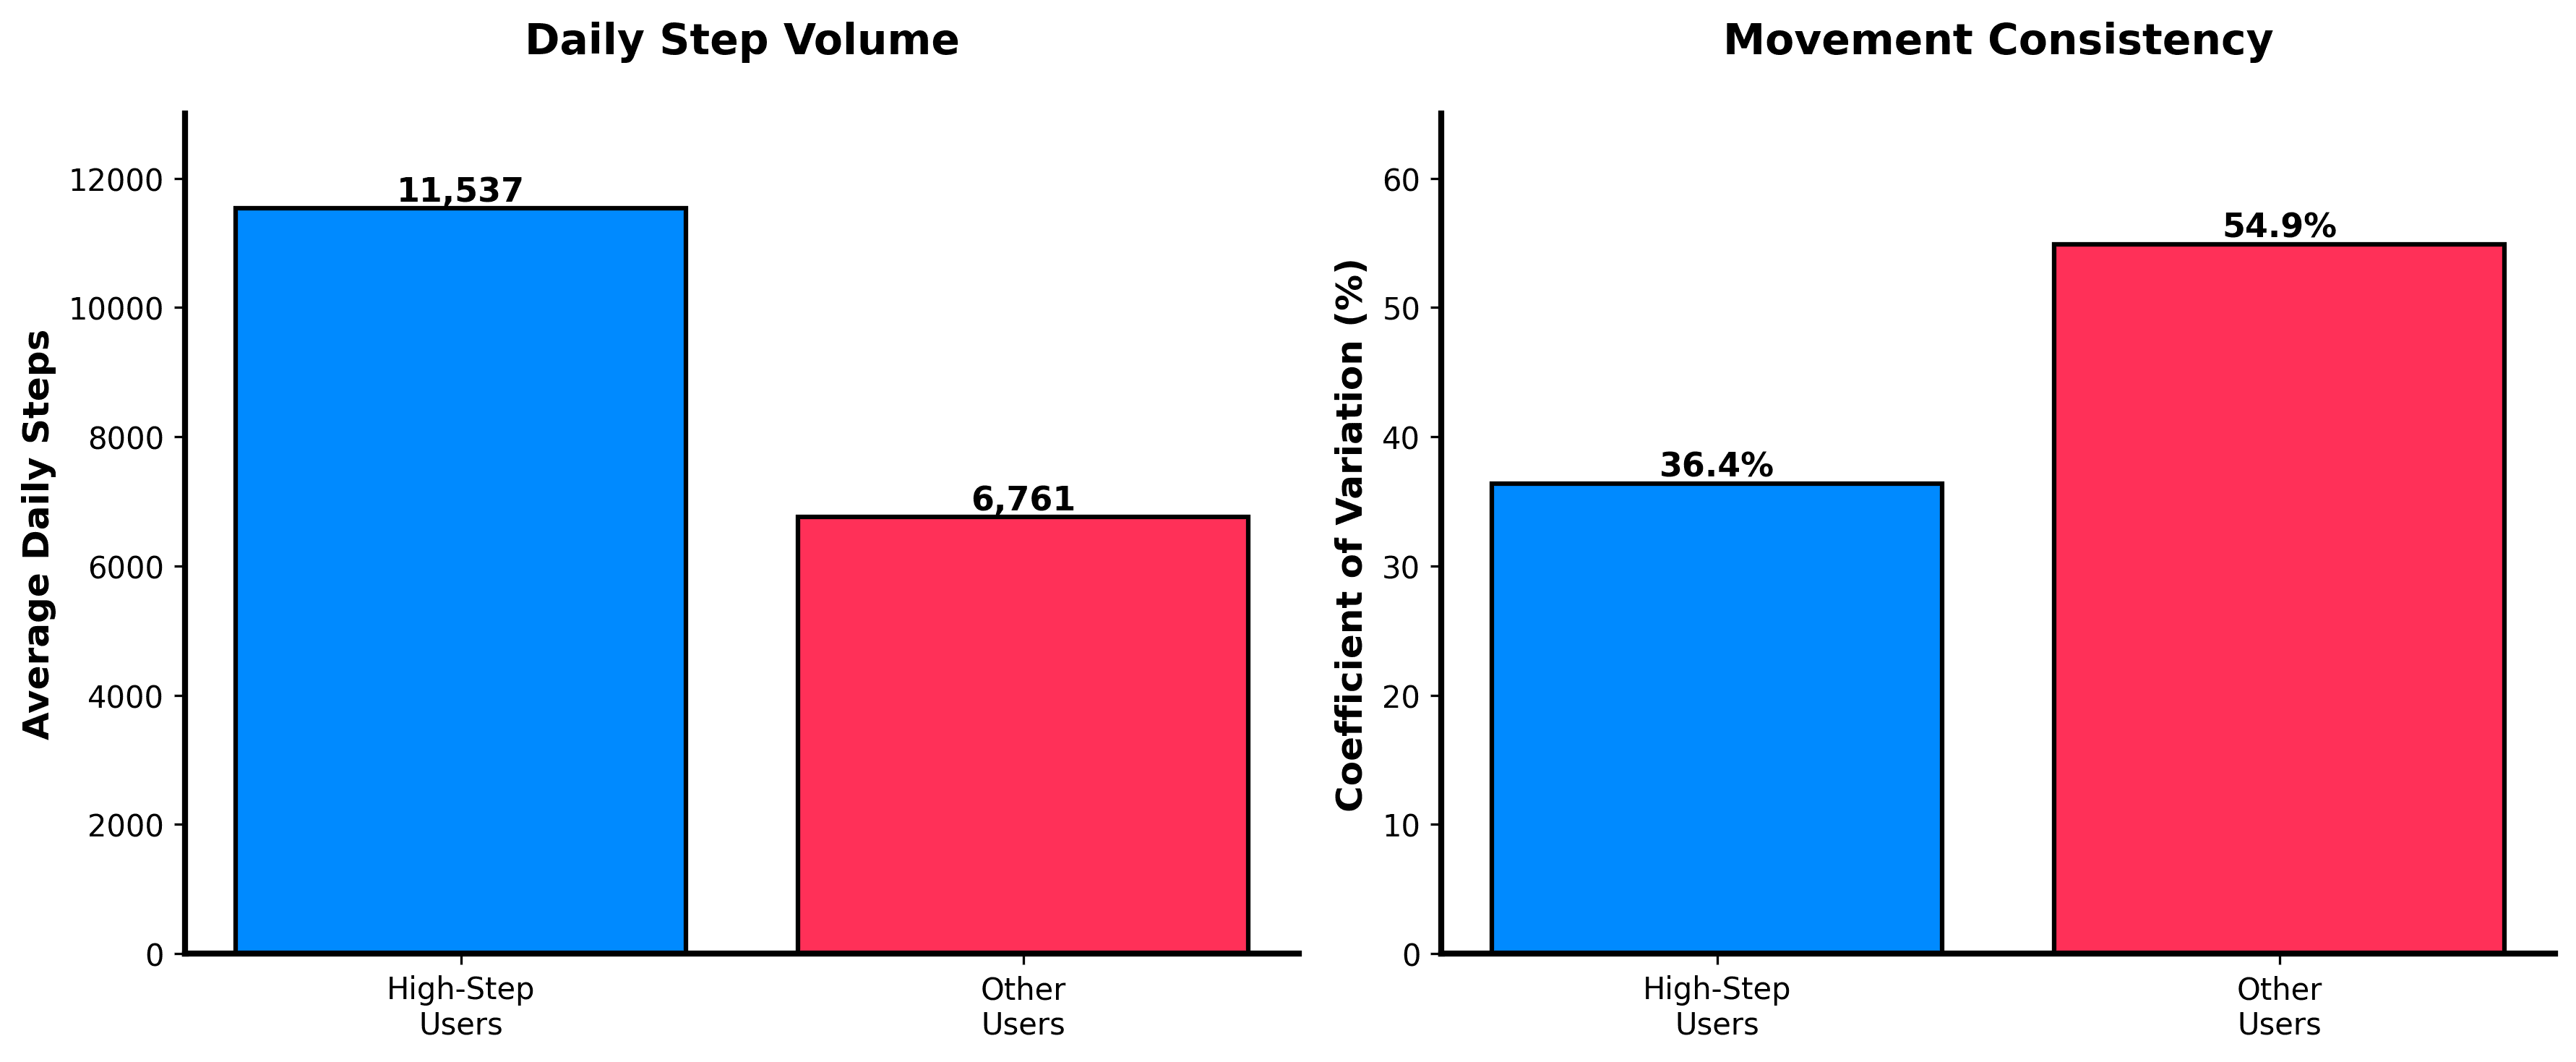
- There are some step champions out there: High-step users average over 11,500 steps a day with correspondingly higher activity scores, calorie burn, and logged days.
- Consistency is the secret ingredient: High-step groups show much lower variability (Coefficient of Variation), 36% vs 55% in others, proving that steady, repeatable habits are the key to logging the most exercise over weeks and months.
- This points to the power of practical habits: small, regular behaviours, such as walking meetings, active commutes, and standing desks, build sustainable routines that support health more reliably than occasional extremes.
Sleep Tracking Series
Is Consistency Actually More Important Than Intensity?
In this report, we reveal why high-step users averaging 11,500+ daily steps succeed: consistency. Their 36% activity variability compared to 55% in others shows that steady habits, like walking meetings and active commutes, trump occasional extreme efforts for sustainable health.Retry
Alistair BrownleeHead of Research
Cameron CrawfordAI Engineer
October 23, 2025
Key takeaways
Is Consistency Actually More Important Than Intensity?
As activity data is so essential to all of our lives, I felt the dataset deserved some more attention, so I analyzed the daily activity data of the same users for some deeper insights. By examining step volume (the number of steps people take) and active energy (Calories burned from activity/exercise), I identified eight distinct user profiles, ranging from low-step sedentary types to high-step movers with ample active energy. Group profiling is a tool we use at Terra Research to help inform our logic as we try to make health models individualised. It allows us to ask: How does this group of similar users respond to something? And hopefully see a response that we wouldn’t at the individual level.
Read on for a deep dive into each profile. I’ll highlight differences in steps, active minutes, calories, and Activity Score, and explain why consistency, as measured by the Coefficient of Variation (CV), matters so much. We’ll then examine high-step profile users to identify what sets these step champions apart, and hopefully, you can take away some practical advice for building sustainable habits.
The Eight Activity Profiles (Step Volume × Active Energy)
Roughly half of the cohort live in the middle lane for steps, with the following breakdown: medium steps, low active energy (64 users, 17%); medium steps, medium active energy (58 users, 16%); and medium steps, high active energy (57 users, 15%).
Pushing beyond average steppers, we encounter the heavy hitters: high steps, high active energy (37, 10%); high steps, medium active energy (32, 9%); and high steps, low active energy (24, 7%). At the quieter end, there are low steps, with medium active energy (27.7%) and low (6.7%) activity. Finally, low steps with missing active-energy data (23.6%) complete the picture.
Here’s the summary of how each group moves, how many calories they burn, what Activity Scores they earn and, crucially, how consistent (as measured by Coefficient of Variation) they are:
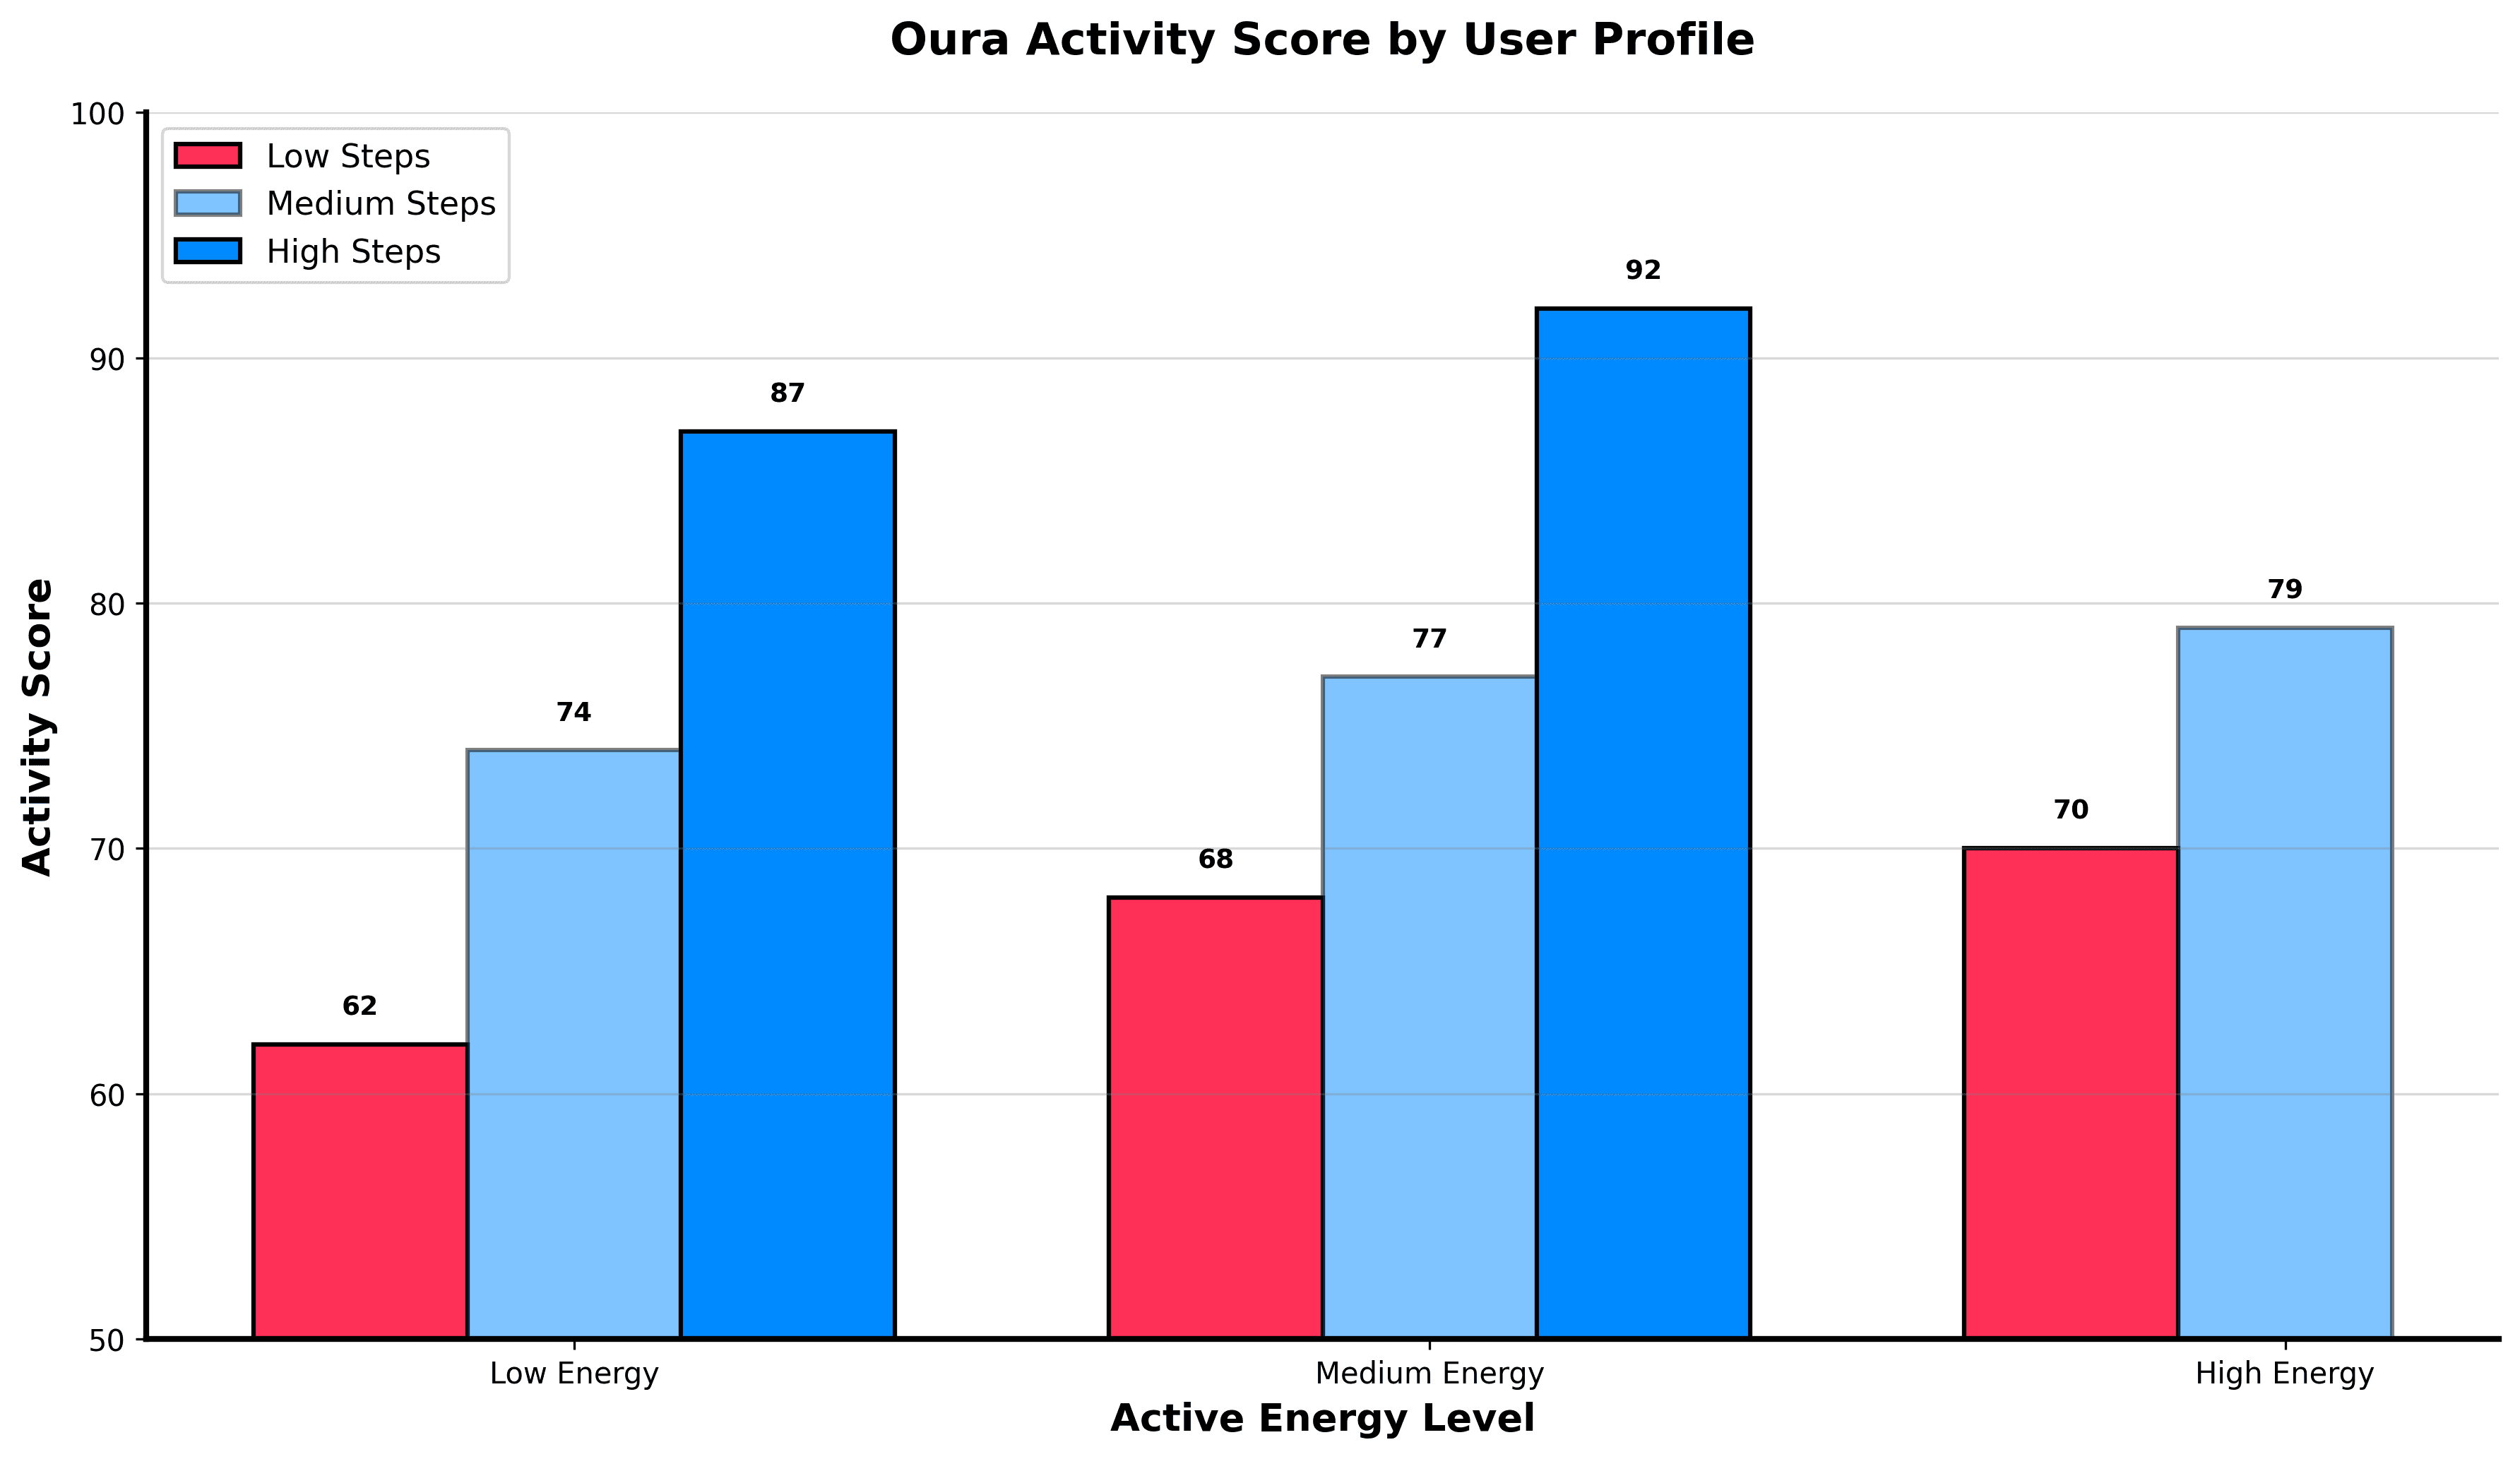
- Low Steps, Low Active Energy. Minimal movement, largely sedentary, Activity Score in the low 60s; daily routine is consistently inactive (moderate CV).
- Low Steps, Medium Active Energy. Occasional brisk walks or workouts but low overall volume; sporadic behaviour gives a high CV.
- Low Steps, High Active Energy. Short, vigorous sessions (HIIT, spin) amid otherwise sedentary days; the most erratic profile with the highest CV.
- Medium Steps, Low Active Energy. Casual movers who stroll through 6–7k steps daily; steady pattern, low CV, Activity Scores typically in the 70s.
- Medium Steps, Medium Active Energy. Balanced lifestyle: 6–10k steps with brisk effort, Activity Scores mid–high 70s, CV moderate.
- Medium Steps, High Active Energy. Frequent vigorous exercise plus only moderate total steps; an all-or-nothing pattern yields a higher CV.
- High Steps, Low Active Energy. On-their-feet lifestyles (e.g. teachers, nurses) racking up 10–12 k+ steps gently; exceptionally steady (very low CV) and high Activity Scores.
- High Steps, Medium Active Energy. The model movers: high step counts and moderate-to-brisk effort, Activity Scores consistently 85–95, CV very low.
- Missing Active-Energy Data. Movement recorded, but no medium/high active-energy periods detected; behaviour mirrors whatever their step volume is.
Get the latest Terra Research reports and insights every week as soon as they're published.
By continuing, I agree to the Privacy Policy and Terms of Service.

Key Comparisons across Profiles
- Steps: High-step users average 11,500+ daily steps – about 70% more than the rest, who hover around 6,700.
- Active Minutes: More steps (obviously!) means more time spent moving; high-step groups log 7.1h/day versus 5.2 h for others.
- Calories: High-step movers burn 8.7 % more total calories (2,591 kcal vs 2,384 kcal).
- Activity Score: Volume plus at least some active energy drives scores. Low-step groups sit in the 50–60s, medium-step in the 70s, high-step in the 80–90s.
- Consistency: CV values highlight reliability: high-step users just 36.4 %, others 54.9 % on average – an 18.5-point gulf.
The High-Step Heroes
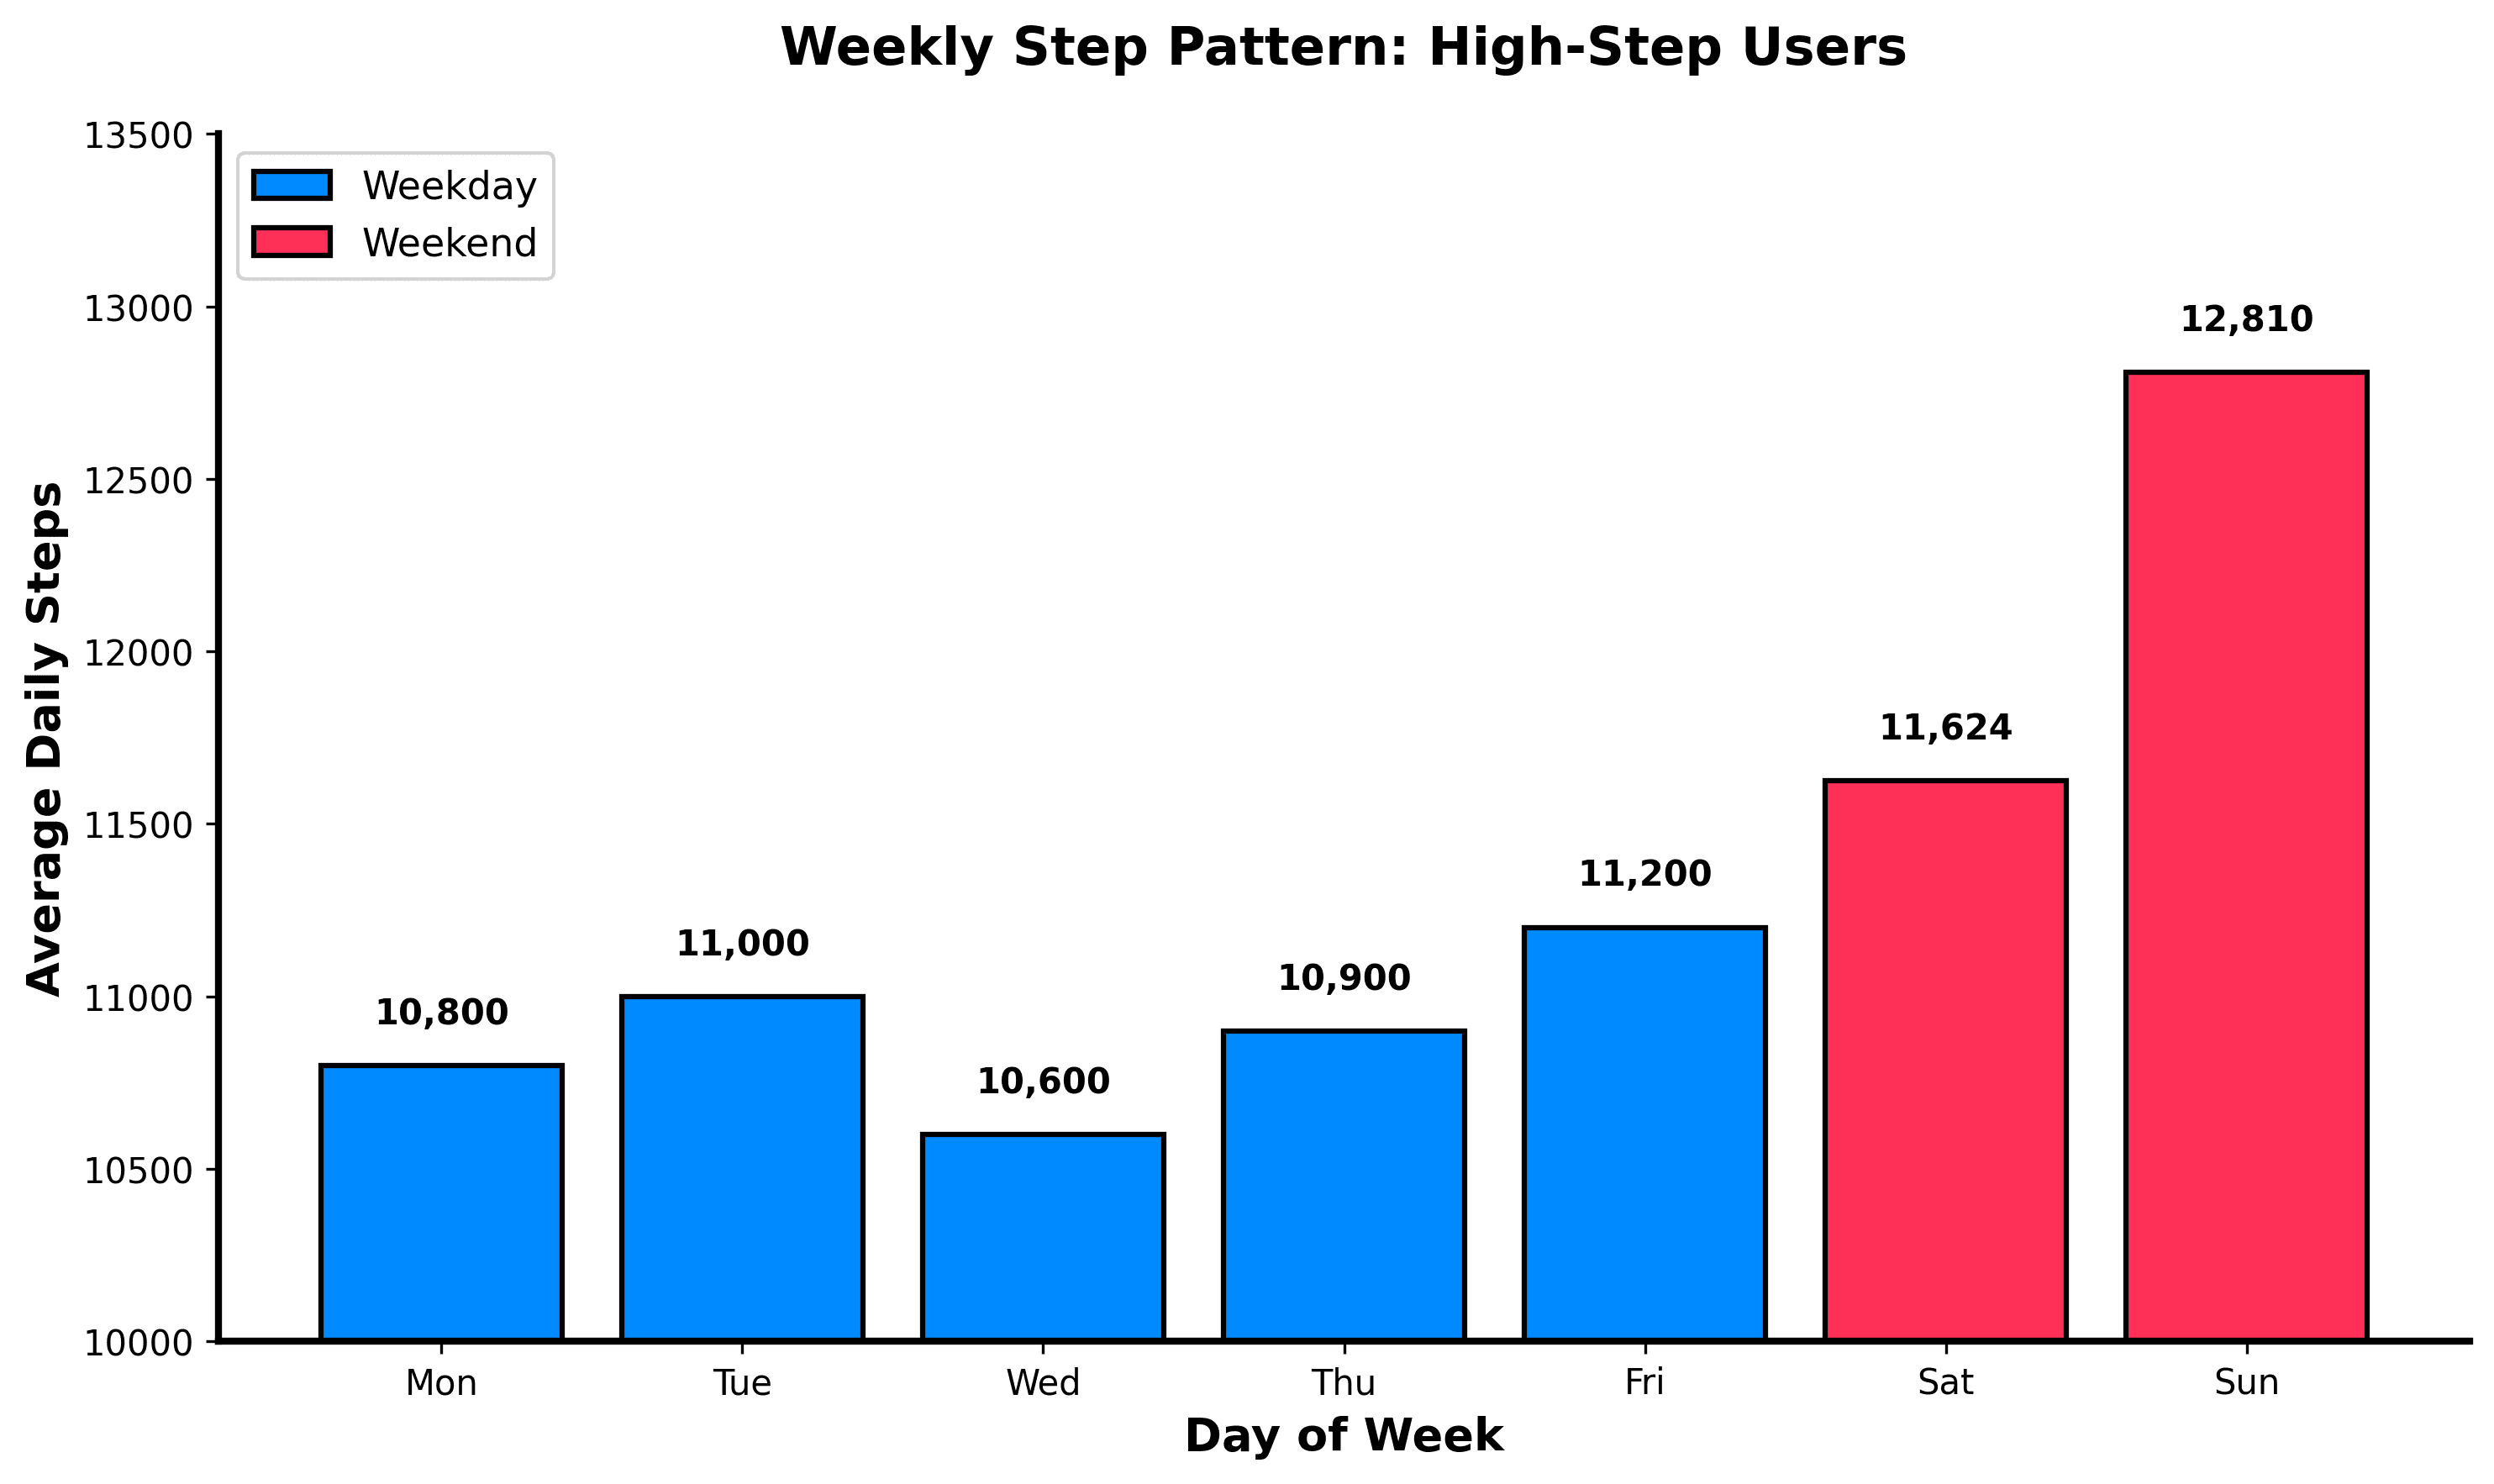
The single biggest mover amassed 1,457,274 steps over 84 days (17,348 per day). All top-ten users exceeded 1.1 million steps, averaging 12,800–17,300 steps daily and tracking for 83–88 days straight. Compared with everyone else, they record:
- +70.6 % more steps (11,537 vs 6,761).
- +35.5 % more active minutes (25,593 seconds per day vs 18,889 s).
- +11.5 % higher Activity Score (92.6 vs 83.0).
- +17.9 % more days logged (83.9 vs 71.1).
Their week shows an even steeper weekend surge: Sunday averages 12,810 steps, Saturday 11,624, with Wednesday still above 10,600. Crucially, their CV is an impressive 36.4 %, underscoring that sheer volume alone does not explain success; regularity does.
Why Consistency Matters
A low CV signals behaviour you can bet on: stress is applied steadily, recovery keeps pace, and habits cement. The human body likes consistency; that way, it doesn’t have to fight to maintain internal homeostasis. High variability, the hallmark of many low-step, high active-energy “boom-and-bust” patterns, increases injury risk, hinders adaptation and often derails motivation. Studies show that regular, moderate activity drives weight control, lowers blood pressure and improves mood more reliably than erratic bursts. Think of CV as your habitometer: if yours is high, aim to lift the low days rather than inflating the peaks.
Takeaways
- Move daily. Even ten minutes of walking on your busiest day keeps CV in check and habits alive.
- Raise your baseline gradually. Add 2,000 steps to your daily average before dreaming of the big weekends.
- Mind your CV. Got roller-coaster patterns? Smooth them by sprinkling light activity on days you wouldn’t normally move.
- How do I do this? Walking meetings, standing desks, and (my personal favourite) active commutes turn movement into habits.
Summary
- Is consistency really more important than intensity for daily activity?
- Yes — the data backs this clearly. High-step users had a Coefficient of Variation (CV) of just 36.4% versus 54.9% for everyone else, an 18.5-point gap, and they posted Activity Scores of 92.6 compared to 83.0. Volume alone didn't explain their success; the regularity of their movement did.
- How many steps do the most active users actually take?
- The high-step cohort averaged 11,537 steps per day — about 70.6% more than the 6,761 logged by everyone else. The single biggest mover hit 1,457,274 steps over 84 days, or 17,348 daily, and all top-ten users exceeded 1.1 million steps while tracking 83–88 days straight. Sustained high volume, not occasional spikes, defined this group.
- Why am I not seeing results despite doing intense workouts?
- You may be in a 'boom-and-bust' profile. Users with low steps but high active energy — short HIIT or spin sessions on otherwise sedentary days — had the highest CV of any group, meaning the most erratic behaviour. High variability increases injury risk, hinders adaptation and undermines motivation, which is why short bursts of intensity often underperform steady daily movement.
- How much does step volume affect my Activity Score?
- A lot — more than intensity does. Low-step users scored 62–70, medium-step users 74–79, and high-step users 87–92, regardless of active energy level. Even high-step, low active-energy profiles (think teachers and nurses on their feet) earned top-tier Activity Scores thanks to consistency alone.
- Can wearable data identify meaningful activity patterns across users?
- Yes. Profiling 379+ users by step volume and active energy revealed eight distinct behavioural profiles, from sedentary low-CV routines to erratic high-intensity boom-and-bust patterns. Group profiling lets researchers see responses at the cohort level that individual data alone would miss, which is how the consistency signal emerged so clearly.
- Do high-step users slack off on weekends?
- The opposite — they ramp up. Sunday averaged 12,810 steps and Saturday 11,624 for high-step users, while even midweek days like Wednesday stayed above 10,600. Their pattern shows a steady weekday floor with a weekend surge, not a weekend-warrior compensation pattern.
- How much more do high-step users actually burn in calories?
- Less than you'd expect given the step gap. High-step movers burn 8.7% more total calories (2,591 kcal vs 2,384 kcal) and log 35.5% more active minutes, despite taking 70% more steps. The takeaway: extra steps deliver outsized gains in consistency and Activity Score, but only modest gains in raw calorie burn.
- What's the practical way to improve my activity consistency?
- Lift your low days rather than inflating your peaks. Even 10 minutes of walking on your busiest day keeps your CV in check, and adding roughly 2,000 steps to your daily baseline matters more than chasing big weekend efforts. Walking meetings, standing desks, and active commutes are the mechanisms that turn movement into a low-CV habit.
Continue reading
Running
Data Shows Most Runners Don't Actually Get Faster
How do runners actually get faster? We analyzed 856,000 running activities to find out who actually gets faster. It wasn't the intense ones, but rather the consistent ones. Showing up month after month beat everything flashier. Boring, as it turns out, is fast.
May 7, 2026

Marathon Series
The Data Behind the London Marathon
While Sabastian Sawe was busy breaking the two-hour marathon barrier in London, the watches of 571 amateur runners told a quieter but equally fascinating story. GPS devices over-measured the course by 527 metres on average, faster runners ran with higher heart rates than the slower ones did, and Coros watches reported 47% more calories per kilometre than physiology actually supports.
April 27, 2026

London Data
Tube Strikes Made Londoners Active
During the April 2026 Tube strikes, Londoners adapted by cycling more—activity tripled, e-bike commutes rose 13%, and 19% of cyclists were entirely new to riding. Data analysis of 1,566 weekday rides revealed e-bike share jumped from 54.9% to 67.5%, with commutes often staying local. The strikes disrupted transit but highlighted Londoners' resilience in finding alternative ways to move.
April 24, 2026

Endurance Training
Running Is The Hardest Endurance Sport? Not so Fast
Which sport is hardest on the heart? We ran the question through hundreds of thousands of sessions across nine activity types. Running dominates minute-for-minute. It has the highest average, highest peak, highest sustained intensity. But its shorter sessions mean total cardiovascular load per outing often falls behind skiing or hiking. The shape of the heart rate curve tells a different story for every sport, and the weighting method you pick changes the answer.
April 23, 2026