- GLP-1 users take fewer steps — and it lasts. Activity drops on medication days and stays suppressed for up to 7 days, with effect sizes growing over longer windows.
- Heart rate goes up, HRV goes down. Autonomic markers shift in the wrong direction 2–7 days post-intake — consistent across users, small but statistically significant.
- The pattern holds across 538 users. Using a within-person design, every individual is compared to their own baseline — these aren't outliers, they're population-level trends.
Peptides
GLP-1s: The Real Tradeoffs Nobody Tells You About
We studied 500+ users. Notable side effects are activity drops, resting heart rate rises, and HRV drops well below average.
Rocio Mexia DiazAI and Health Researcher
Halvard RamstadEditor-in-Chief
Alistair BrownleeHead of Research
March 12, 2026
Key takeaways
At Terra, we like to peek into our body and physiology through the lens of our wearables. Our goal is not to claim the causes behind our physiological changes, but to describe the most consistent patterns seen across users.
In this blog we looked at how people respond to taking GLP-1 medication. This drug is often used to treat type 2 diabetes and obesity and acts by mimicking the GLP-1 hormone produced in the intestine that helps regulate blood sugar by stimulating insulin release and inhibiting glucagon [1].
Although medication effects often unfold over days or weeks, wearables are good at capturing day‑to‑day changes that reflect drug effects like changes in appetite, energy, and autonomic physiology [2].
The Data
We used daily wearable data from 538 users that reported taking GLP-1 medication. Each tag is assumed to mean the medication was taken that day, but we do not assume that a missing tag means no medication was taken. That makes this a conservative, correlation‑only analysis.
We use a within‑person approach (each person is compared to their own baseline) so that we minimize differences that come from individual variability.
We applied strict inclusion rules to reduce noise
- ≥30 days of wearable data
- ≥5 GLP tags
- ≥7 days of pre-GLP baseline
We report results that are statistically significant (p < 0.05) and meaningful (Cohen d > 0.2).
Effect sizes:
- Small: |d| 0.2–0.5
- Medium: |d| 0.5–0.8
- Large: |d| ≥0.8
Get the latest Terra Research reports and insights every week as soon as they're published.
By continuing, I agree to the Privacy Policy and Terms of Service.

Activity changes
The largest effect seen in our cohort was a reduction in activity with exposure to GLP.
We performed various analyses to understand both the immediate and long-standing pharmacological effects of GLP.
We compared GLP days to non-GLP days, and we also assumed a 5 and 7-day sensitivity window to test these sustained effects.
Steps drop on GLP days and the days after. These effects are statistically significant with small effect sizes but appear across same‑day, next‑day, and lagged analyses. Effect sizes also increase when comparing the 5- and 7- day active windows.
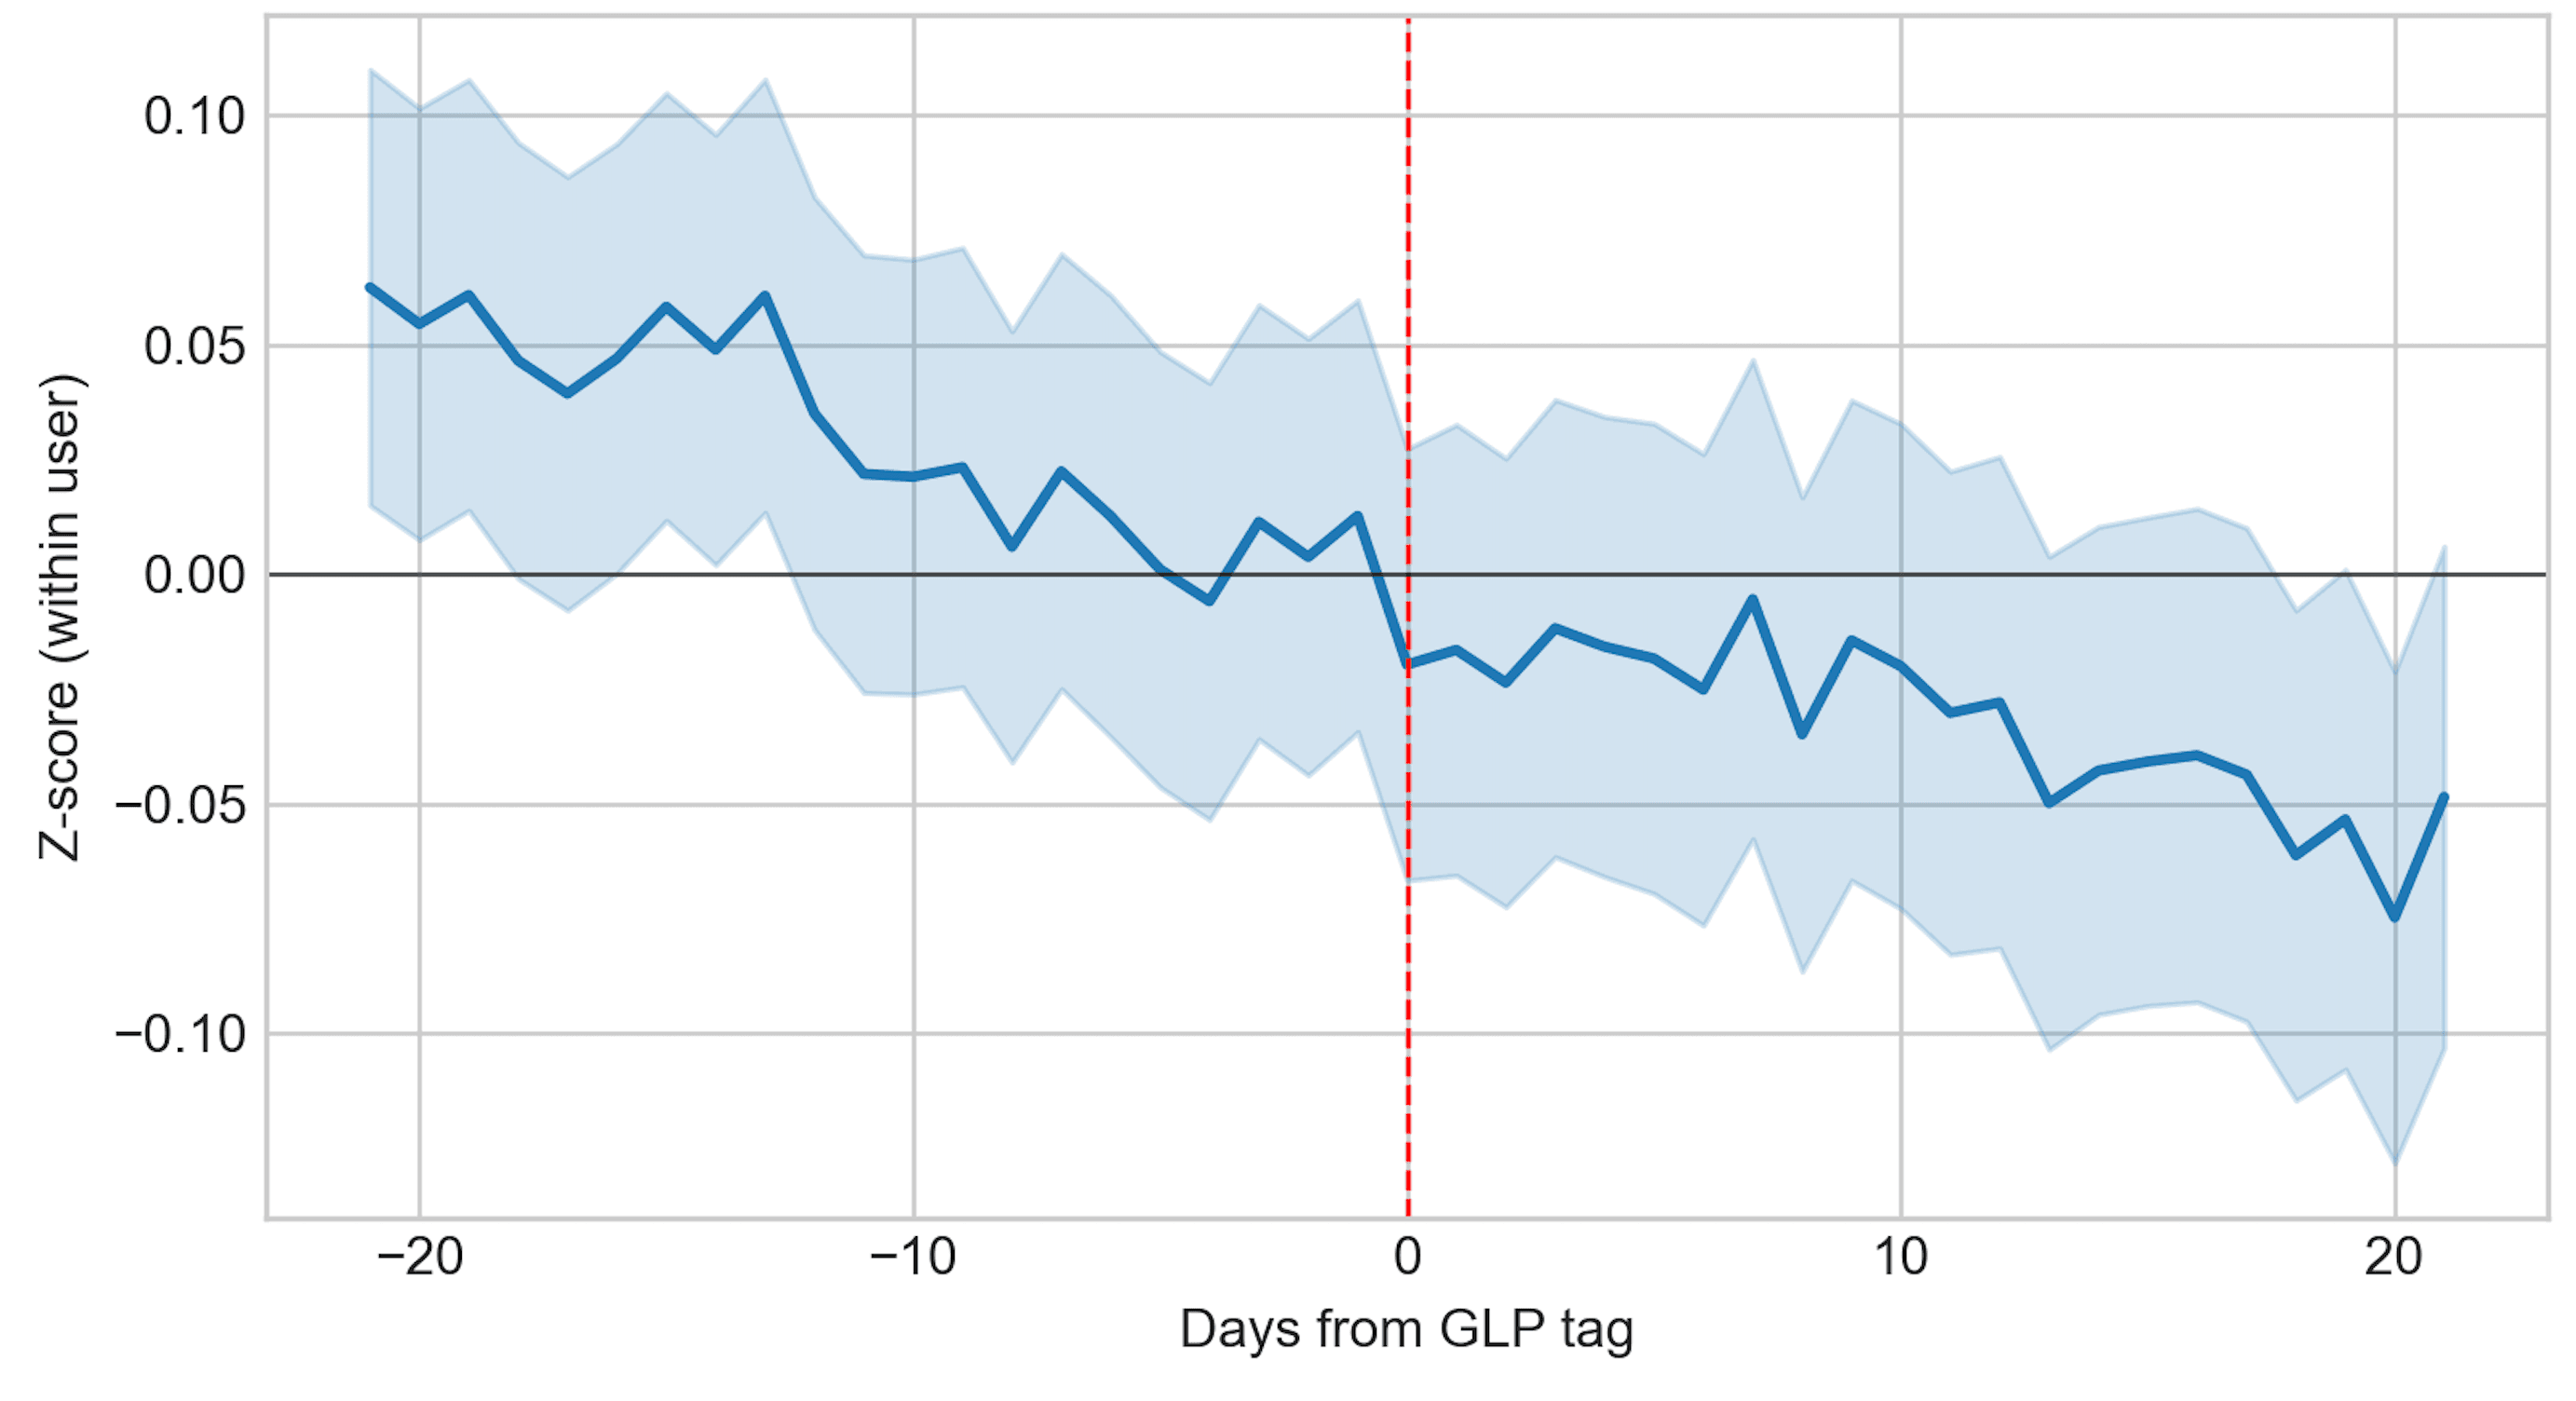
This means that GLP exposure aligns with lower activity. A plausible explanation is transient side‑effects (e.g., reduced appetite, mild nausea, or fatigue)[3], but the data cannot confirm cause.
Physiological Changes
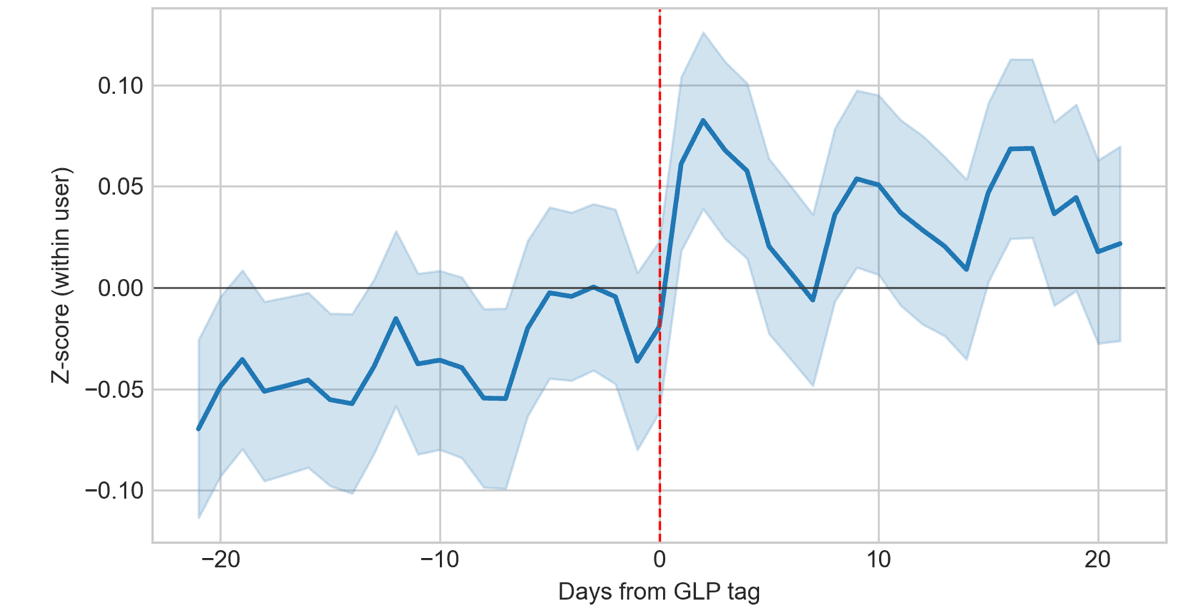
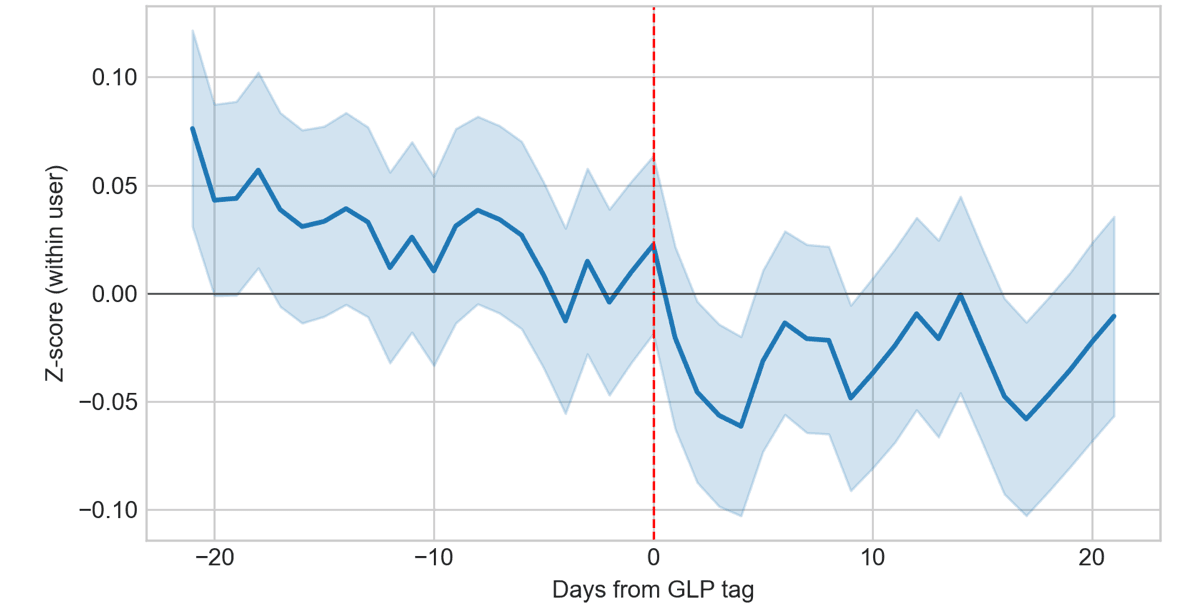
Minimum heart rate increases and HRV drops after GLP exposure, and does most clearly 2-7 days post GLP intake. This could reflect autonomic adjustments, dose titration or behavioral changes. Causality cannot be determined from tags alone.
What does this mean?
If you are taking a GLP medication and tracking your wearable data, the most likely signal you would notice is a reduction in steps or low‑intensity activity around the time of exposure. Smaller physiologic signals (like minimum heart rate and HRV shifts) are present but would be harder to detect without careful analysis. If your wearable patterns match these trends, that doesn’t prove medication effects, but it suggests your data is tracking similar population‑level patterns.
References
[1] Areesha Moiz, Kristian B. Filion, Michael A. Tsoukas, Oriana HY. Yu, Tricia M. Peters, Mark J. Eisenberg, Mechanisms of GLP-1 Receptor Agonist-Induced Weight Loss: A Review of Central and Peripheral Pathways in Appetite and Energy Regulation, The American Journal of Medicine
[2] Gregory J. Grosicki, Jeongeun Kim, Finn Fielding, Summer R. Jasinski, Christopher Chapman, William von Hippel, and Kristen E. Holmes, Heart and health behavior responses to GLP-1 receptor agonists: a 12-wk study using wearable technology and causal inference, American Journal of Physiology-Heart and Circulatory Physiology
[3] Oshi Health. (2025, August 19). GLP-1 nausea: How to handle GLP-1s' most common side effect. https://oshihealth.com/glp1-nausea/
Summary
- Does taking a GLP-1 actually reduce how much I move each day?
- Yes — across 538 users tracked with wearables, the largest signal observed was a drop in daily steps on GLP-1 days and the days following. The effect was statistically significant and showed up consistently in same-day, next-day, and 5- to 7-day lagged analyses, with effect sizes growing as the active window widened. Activity stayed below each user's personal baseline for 20+ days after exposure.
- How long do the activity effects of a GLP-1 dose actually last?
- Longer than a single day. In this within-person analysis of 538 users, steps trended downward before the first tag and remained below baseline for 20+ days after exposure. That suggests the behavioral footprint of GLP-1s isn't just an acute same-day effect — it's a sustained shift in low-intensity movement.
- Why am I feeling less active or energetic on a GLP-1?
- The data can't prove cause, but the step reduction aligns with well-documented transient side effects of GLP-1s like reduced appetite, mild nausea, and fatigue. Because the activity drop persists for weeks rather than hours, behavioral changes around eating and energy intake are a plausible driver. If your wearable shows a step decline around dosing, you're tracking the same pattern seen across the cohort.
- Do GLP-1s affect my heart rate and HRV?
- Yes, but the signals are smaller than the activity changes. Minimum heart rate rose most clearly 2–7 days after a GLP-1 tag, and HRV dropped below baseline and stayed suppressed for 20+ days. These shifts could reflect autonomic adjustments, dose titration, or downstream behavioral changes — the tags alone can't isolate the mechanism.
- Can wearables actually detect GLP-1 medication effects?
- They can detect the behavioral and physiological footprint. Using a within-person z-scored approach across 538 users with at least 30 days of data, 5+ GLP tags, and a 7-day pre-baseline, the analysis surfaced statistically significant effects (p < 0.05) with Cohen's d > 0.2 in steps, minimum heart rate, and HRV. Wearables won't tell you the drug is working pharmacologically, but they reliably track the day-to-day changes that accompany it.
- What's the single biggest change I should expect to see in my wearable data?
- A reduction in steps and low-intensity activity around the time of dosing. That was the largest and most consistent effect in the cohort, visible on GLP days, the day after, and across 5- and 7-day windows. Heart rate and HRV shifts are present but subtle enough that most users won't notice them without structured analysis.
- Does this study prove GLP-1s cause these changes?
- No — and the authors are explicit about that. Because a missing tag isn't assumed to mean no medication, this is a conservative, correlation-only analysis. The within-person design (each user compared to their own baseline) controls for individual variability, but causality can't be established from self-reported tags alone.
- Should I be worried if my HRV drops after starting a GLP-1?
- A drop is consistent with what 538 users showed in aggregate — HRV fell below personal baseline and remained suppressed for 20+ days post-exposure. This may reflect autonomic adjustment, titration, or reduced activity rather than something pathological. If your data mirrors the cohort pattern, it suggests your physiology is responding the way most users' do, not that something is wrong.
Continue reading
Running
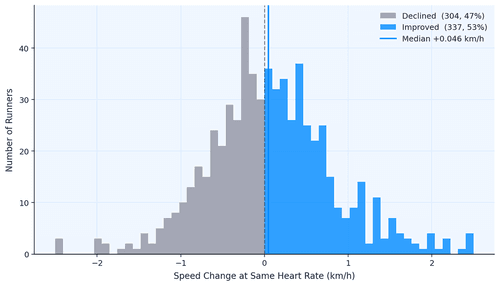
Data Shows Most Runners Don't Actually Get Faster
How do runners actually get faster? We analyzed 856,000 running activities to find out who actually gets faster. It wasn't the intense ones, but rather the consistent ones. Showing up month after month beat everything flashier. Boring, as it turns out, is fast.
May 7, 2026

Marathon Series
The Data Behind the London Marathon
While Sabastian Sawe was busy breaking the two-hour marathon barrier in London, the watches of 571 amateur runners told a quieter but equally fascinating story. GPS devices over-measured the course by 527 metres on average, faster runners ran with higher heart rates than the slower ones did, and Coros watches reported 47% more calories per kilometre than physiology actually supports.
April 27, 2026

London Data
Tube Strikes Made Londoners Active
During the April 2026 Tube strikes, Londoners adapted by cycling more—activity tripled, e-bike commutes rose 13%, and 19% of cyclists were entirely new to riding. Data analysis of 1,566 weekday rides revealed e-bike share jumped from 54.9% to 67.5%, with commutes often staying local. The strikes disrupted transit but highlighted Londoners' resilience in finding alternative ways to move.
April 24, 2026

Endurance Training
Running Is The Hardest Endurance Sport? Not so Fast
Which sport is hardest on the heart? We ran the question through hundreds of thousands of sessions across nine activity types. Running dominates minute-for-minute. It has the highest average, highest peak, highest sustained intensity. But its shorter sessions mean total cardiovascular load per outing often falls behind skiing or hiking. The shape of the heart rate curve tells a different story for every sport, and the weighting method you pick changes the answer.
April 23, 2026